


Welcome to our final round-up of 2023!
This quarter, we’re bringing some exciting new features to your ribbons in PowerPoint and Excel, as well as some efficient updates to a few UpSlide classics.
Read on to discover how to build even more detailed financial charts, manage Excel links even more efficiently, and add footnotes to PowerPoint decks as easily as you would in Word.
All Users Can Now Access the Excel Link Manager
We teased this update in last quarter’s round-up, but we’re continuing to bring more improvements to the new Excel Link Manager.
If you’re building a lot of recurring reports or pitchbooks in PowerPoint, you’ll want to check this out.
The Excel Link Manager is now available for everyone, though you will need to switch it on via the Update All menu in your current ribbon.
Since our testing phase last quarter, we’ve added even more functionality to this feature.
You can now:
- Locate links even faster within your presentations with the ability to filter links by slide, section or source.
- Fix individual source issues via an intuitive pop-up pane with clearer error descriptions, time stamps, and CTA buttons.
Discover more about this feature.
Assign a Template to Each of Your Teams
Are your UpSlide users finding themselves with too many options in their Templates menu?
Make it even easier for teams to access the most relevant and useful templates for their work in PowerPoint with the option to segment templates for different user groups.
That means no more deal teams accidentally using reporting templates – or vice versa – and ultimately more consistency and impact across every company-wide presentation.
Find out how to segment Templates across your teams.
Seamlessly Insert Footnotes in PowerPoint
Looking for an easy way to reference information on your slides? Say goodbye to manually adding superscripts and text boxes for every citation.
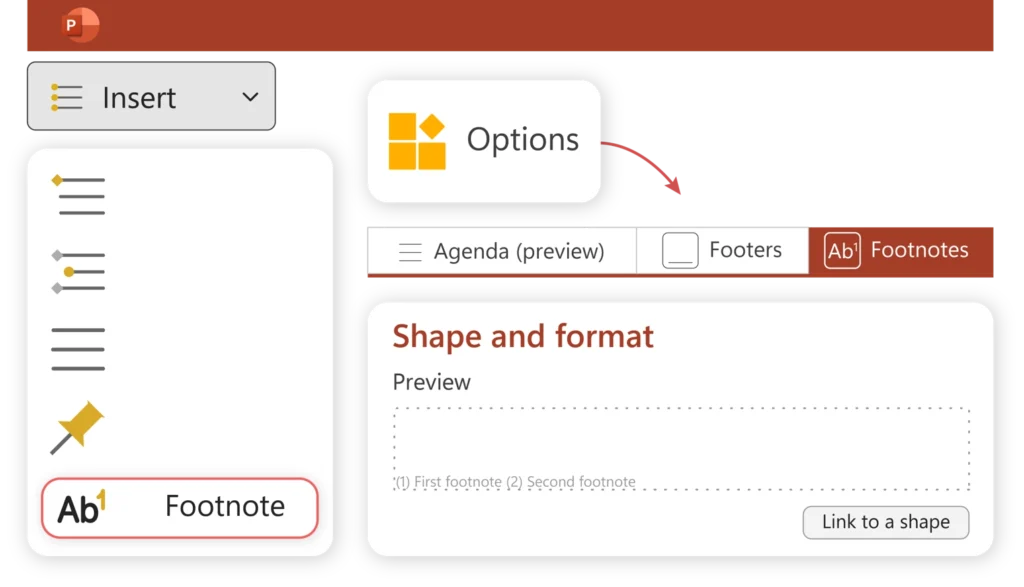
Whether you want to cite a data source, reference an informative study, or disclose your methodology for a valuations model, UpSlide enables you to create PowerPoint footnotes as seamlessly as you would in Word.
To ensure maximum consistency across your presentation, we also made sure you can customize the footnote formatting across your deck directly from the “Options” pane.
Your UpSlide admin can also set a best-practice footnotes style for all users via your company Templates.
Discover how to insert a footnote in two clicks here.
Automate Even More Financial Charts in Excel
Did you know UpSlide helps you build Stacked Waterfall charts in Excel? That’s on top of Marimekko charts, and Waterfall charts.
How can you build a stacked waterfall chart in Excel?
Within the Charts dropdown in Excel, simply select the Stacked Waterfall option. UpSlide now gives you the option to segment each bar per individual data source; plus, you can now present both positive and negative data values within individual bars.
This will all be done in your company’s branding, so you can spend less time on Excel formatting, and more time on your reporting and analysis.
Discover more about automated stacked waterfall charts.
Top tip:
If you’re still building your charts manually in Excel, discover how UpSlide can help you do so in one click.
Edit Your Power BI Visuals Directly Within PowerPoint
We’re bringing even more updates to help you streamline your reporting between Power BI and PowerPoint.
This latest update enables you to edit hierarchy slicers on your tables and charts directly where they appear in your PowerPoint deck.
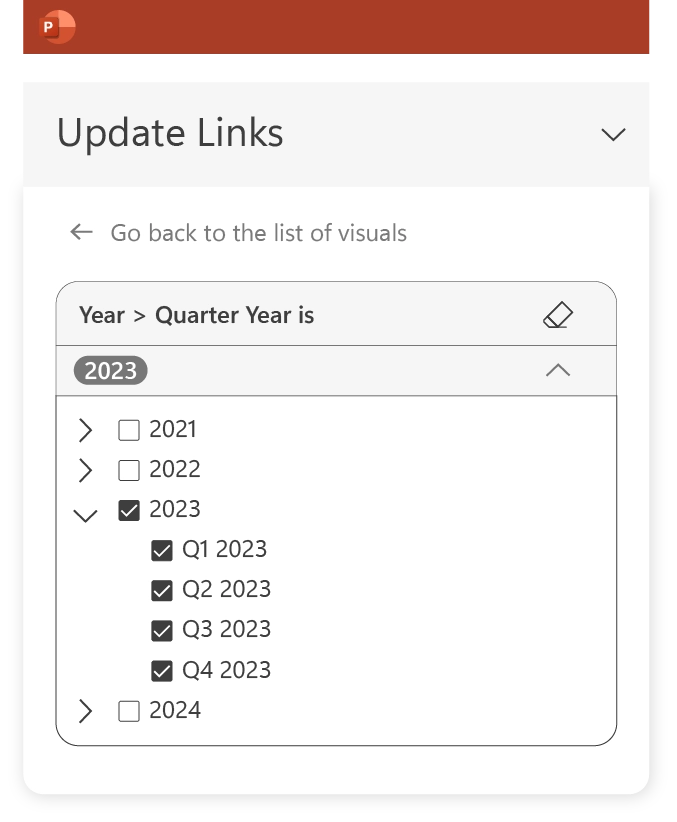
Where previously you would have had to reimport Power BI visuals after editing the hierarchy slicers in a separate Power BI window, with UpSlide’s Power BI add-in for PowerPoint, your entire reporting workflow can take place within PowerPoint.
Discover more about this feature.
Bonus: New AI Features in Your UpSlide Ribbon
Are you regularly producing presentations that contain a lot of specialized terminology and abbreviations?
If so, UpSlide can now generate a glossary within your PowerPoint presentation in one click to help readers reference any unknown acronyms.
Using Microsoft Azure AI, UpSlide reads the sentence before and after an abbreviation to contextualize it before adding it to a glossary table at the end of your presentation. The table will be alphabetically organized and preformatted to your graphic guidelines.
Contact your dedicated UpSlide consultant to find out more.
Thank you for reading this edition of UpSlide’s new feature round-up. Sign up to our quarterly newsletter to stay updated with our latest product updates and feature improvements.