


Let’s explore efficient ways of linking Excel to PowerPoint—from native embedding to UpSlide’s dynamic link that won’t break (unless you want it to!).
Top 3 Methods of Linking Data, Charts and Graphs from Excel to PowerPoint
Method 1: Native Embedding to Create an Excel-PowerPoint Link
Pros: It’s an easy, free solution available to all Microsoft users.
Cons: PowerPoint documents can become heavy quickly and updating can be hugely time-consuming if data changes. The interface is also limited, and there’s a lack of control over which data points you’d like to update.
To get started:
- Open your Excel workbook and select the chart you want to export.
- On the Home tab, in the Clipboard group, click Copy (or press Ctrl+C).
- Open the PowerPoint slide you want to insert the chart into.
- On the Home tab, click the options arrow below Paste, and then do one of the following:
a. Select Embed if you want the chart to keep the same look and appearance as the Excel file.
b. Choose Keep source formatting if you want the chart to use the look and appearance of the PowerPoint presentation.
How to Update Your Data in PowerPoint
First, right-click on the chart and select “Worksheet object“ from the dropdown menu. Then either:
- Select Edit to open the linked data on a basic spreadsheet and make changes to the input. Changes made here will be saved to that Excel spreadsheet and will impact your source file.
- Select Open to view the data within the original workbook in Excel. This works when Excel is either open or closed.
Method 2: Use Special Paste to Create the PowerPoint and Excel Link
Pros: Free with native Microsoft 365 and a feasible solution if your workload is very light.
Cons: It carries a risk of inaccurate data, is restrictive for financial analysis and recurring report creation, and the link can break if either Excel or PowerPoint files are duplicated.
To get started:
- Open your Excel workbook and select the chart you want to link. Tip: Make sure your workbook is saved.
- On the Home tab, in the Clipboard group, click Copy (or press Ctrl+C).
- Open the PowerPoint presentation and select the slide you want to insert the chart into.
- On the Home tab, click the arrow below Paste, and then click Special Paste.
- Select Paste Link.
- Select Microsoft Excel Worksheet Object (or Microsoft Excel chart Object if it’s a chart).
How to Update Your Excel Data in PowerPoint
There are two ways of updating data, depending on whether or not your Excel workbook is open alongside PowerPoint.
Let’s consider two scenarios:
Both Your PowerPoint and Excel Files are Open
If you’ve got PowerPoint and Excel open, any changes on the Excel spreadsheet are automatically updated onto your presentation.
However, this gives a lack of control over which data points you want to update to your PowerPoint, and the link can easily break if a file name changes or is moved around.
Only Your PowerPoint File is Open
If the Excel file is closed and you’ve just opened your PowerPoint presentation, you’ll be asked if you want to Update the links or not.
Unfortunately though, updating just one data point can take a long time, and isn’t feasible for heavy workloads.
Note: This process works exactly the same for tables.
Method 3: UpSlide’s Dynamic Excel to PowerPoint Link
Pros: A super robust link that survives file changes (such as duplication, relocation or renaming), is super easy to use, and perfect for large teams. Regular software updates ensure it always adapts to your firm’s needs.
Cons: It comes at a cost (however, reaps long-term ROI with time saved), and is only available for teams of five or more.
Did You Know?
32% of innovation leaders at investment banks prioritize clear ROI metrics when evaluating document automation solutions. For significant ROI over the long-term, robust reporting software that guarantees accurate data and saves analysts time is a must for firms looking to grow.
Using native embedding can be problematic, so many professionals prefer copying and pasting. However, manually checking that every figure has been updated properly, plus resizing and aligning tables/charts, can drain your time, energy and increase the likelihood of errors.
So, let’s explore how to use UpSlide’s dynamic Excel to PowerPoint Link and solve these problems.
How to Use UpSlide’s Robust Link
- Open your Excel workbook and select the graph, chart or table you want to link to PowerPoint.
a. Make sure your workbook is saved. - Open up your PowerPoint and select the placeholder you want the data copied into.
- Switch back to your Excel workbook.
- From your UpSlide ribbon, hit the PowerPoint button and Export to PowerPoint.
Huge Time Savings
42% of bankers voted data entry and management as the most admin time-consuming task for junior bankers. With UpSlide’s Excel to PowerPoint Link, you can do it in a few seconds!
How to Make Updates to PowerPoint Once the Data is Linked
Unlike native linking features, UpSlide’s Excel to PowerPoint link updates any data changes at the click of a button.
To refresh your Excel data in PowerPoint:
- Update your table, chart or graph with new data in Excel.
- Switch back to your PowerPoint presentation and select Excel Link Manager from your UpSlide ribbon.
- Find the slide(s) that contain the data you need updating and select which tables, graphs or charts you want to apply the update to.
- Select Update.
Your data is now updated exactly how you want it!
How Does File Size Compare Between Microsoft’s Native Links and UpSlide?
PowerPoint presentations that use UpSlide’s Excel to PowerPoint Link are around 10x lighter than those that use native copy and paste. This means that your graphs, charts and tables will look professional without compromising quality.
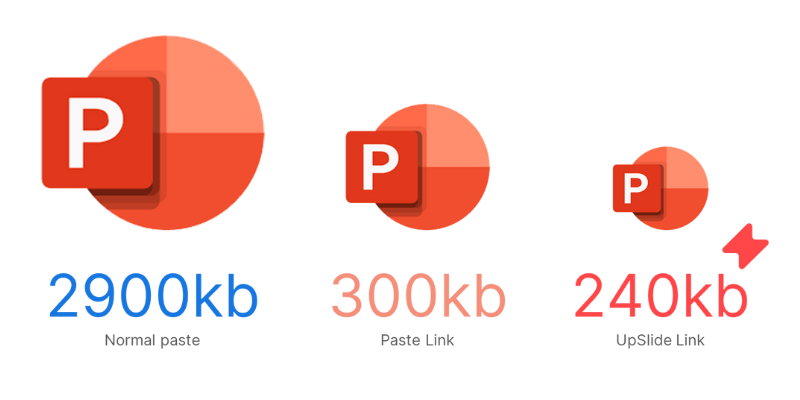
Presentation weight: Based on 100 simple charts and 100 simple tables
Top Tip
To create size-optimized presentations, use UpSlide’s Link (instead of native copy and paste), and export your source data as an enhanced metafile.
Other Benefits of Linking Excel to PowerPoint With UpSlide
Copying and pasting data or screenshotting graphs from Excel into PowerPoint is long-winded, increases the risk of human error, and, let’s face it, quite tedious.
UpSlide dynamically links data to make your workflow easier. Whether you’re creating audit reports, pitchbooks or information memorandums, our Excel to PowerPoint Link has endless benefits.
To name a few:
- Reduce low-value-added tasks and focus on higher-value ones, such as nurturing client relationships, better data analysis or delivering more projects
- Ensure accurate data to maintain client trust (just one small mistake could significantly skew predictions and mean they lose faith in your brand)
- Reduce rounds of reviews, minimize the risk of burnout and boost team morale

Now we’ve covered the benefits, let’s watch a video with our link in action!
Watch How Our Excel to PowerPoint Link Works
Regularly using Power BI for data visualization? Discover how to link Power BI to PowerPoint
TL;DR
There are three options for linking data between Excel and PowerPoint: native copy and paste, Special Paste, and UpSlide’s Excel to PowerPoint Link that automates document creation.
Native features are free but have many limitations and aren’t suitable for higher workloads, such as recurring reports, due to the limited interface and lots of manual work required at scale.
Whilst UpSlide’s Link carries a cost, this money can be easily clawed back in hours saved; the link is far stronger than native features, and large teams that deliver many projects or reports every month will see endless benefits.
Ready to Save Time in Excel?
Hopefully, you’ve found this guide helpful! Please feel free to bookmark it and refer to it later.
If you’d like to see UpSlide’s Excel to PowerPoint Link in action, please book a free discovery call and understand how your teams can build better documents faster.