Want to speed up report creation by connecting Power BI to PowerPoint? Discover five efficient data linking methods, from Microsoft’s native functionality to UpSlide’s dynamic Power BI to PowerPoint Link.
Why Do Finance Teams Export Power BI to PowerPoint?
Over the years, Power BI has become a staple for financial services teams.
With Power BI, finance teams can access interactive online dashboards – or dynamic reports – that allow them to explore their company’s data securely and in real time. The tool is truly revolutionizing data analysis and decision-making across the finance industry.
However, static reports – such as investment memorandums, or portfolio reports – still remain essential to core financial services operations, with many teams spending hours building them in PowerPoint.
What is the difference between a static report and a dynamic report?
Dynamic reports can pull data from multiple sources into a centralized dashboard, where the data is transformed into a range of tables and charts. Unlike dynamic reports in Power BI, which update automatically, the data within PowerPoint-based static reports must be actively updated by the user.
These reports typically require data exports from Excel, and sometimes from dynamic reports within Power BI, for example, when:
- Analyzing, comparing or restoring data from a new angle
- Isolating specific information (removing confidential or irrelevant data)
- Providing commentary on data
- Working on the formatting in new tables and graphs
- Sharing figures with people unfamiliar with Power BI
In this article, we’ll explain five different methods to export Power BI to PowerPoint so you can work more efficiently and tell impactful stories with your data.
Five Ways to Export Power BI to PowerPoint
Option #1 – Export an Image from Power BI to PowerPoint
Microsoft’s native export to PowerPoint within Power BI online is an easy starting point when looking to connect Power BI and PowerPoint.
If you’ve already tried this method? Skip to Option #2 – Embed a Live Report from Power BI into PowerPoint
How to Use this Method
- Within PowerBI online, open a report published on one of your workspaces
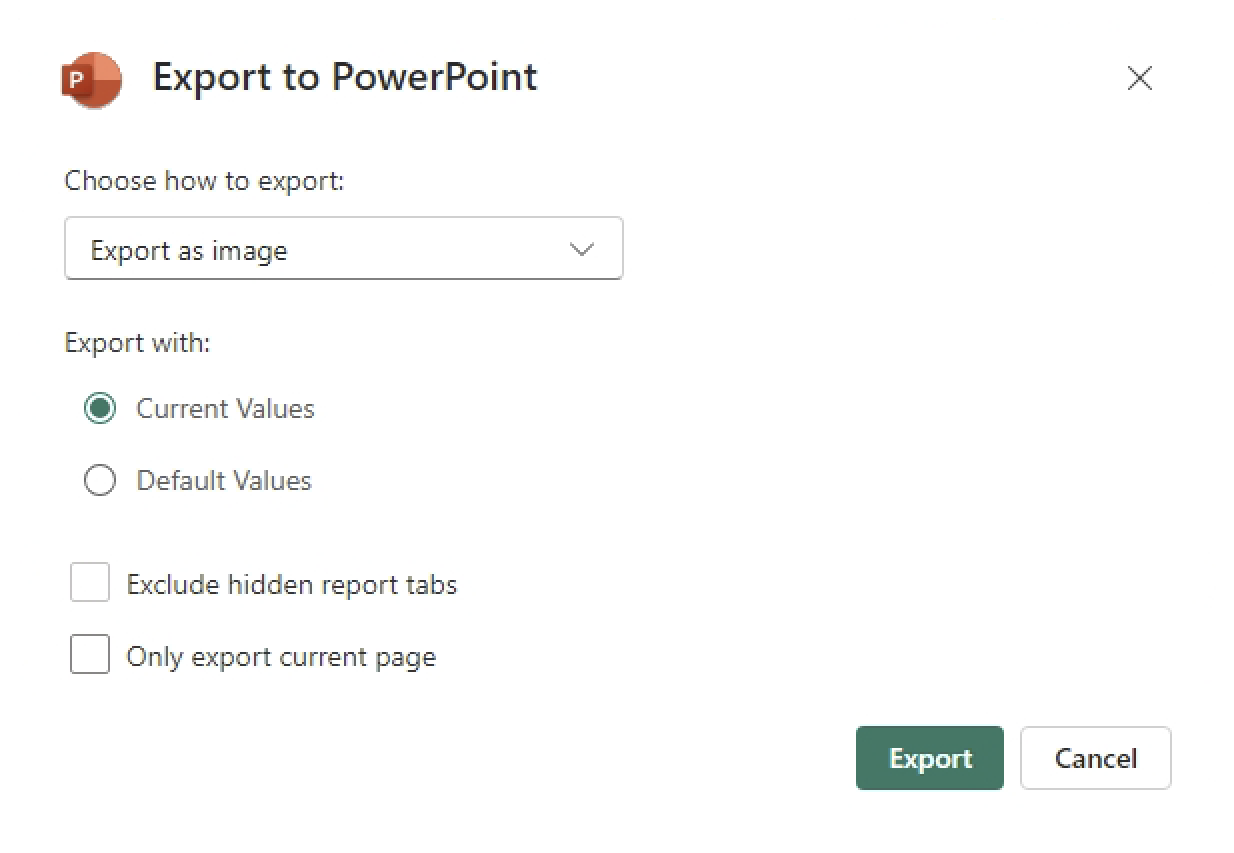
- On your report, click Export, then PowerPoint and choose Export as image
- In the pop-up window, choose Current Values and then click on Export
- This will generate a PowerPoint file containing the relevant Power BI images from your report, ready for you to download
Limitations of the Native Power BI Export:
Inefficient Workflows
The entire process takes place on Power BI online and forces you to cross-reference between the webpage and the static images in your PowerPoint presentation. The data export process can also be time-consuming depending on the size of your report in Power BI.
Off-Brand Formatting
This method generates a new PowerPoint file with the default neutral template, so the result will not comply with your graphic charter.
In addition, the pages of the Power BI report are converted into non-customizable images in a format that is often different to the PowerPoint template.
Option #2 – Embed a Live Report from Power BI into PowerPoint
Microsoft provides the option to embed live data within a PowerPoint deck via Power BI. This will create a new PowerPoint presentation that’s linked to your Power BI dashboard. The data will update dynamically within your slides.
Already tried this method? Skip to Option #3 – Copy and Paste a Power BI Visual into PowerPoint
How to Use this Method
- Within Power BI online, open a report published on one of your workspaces
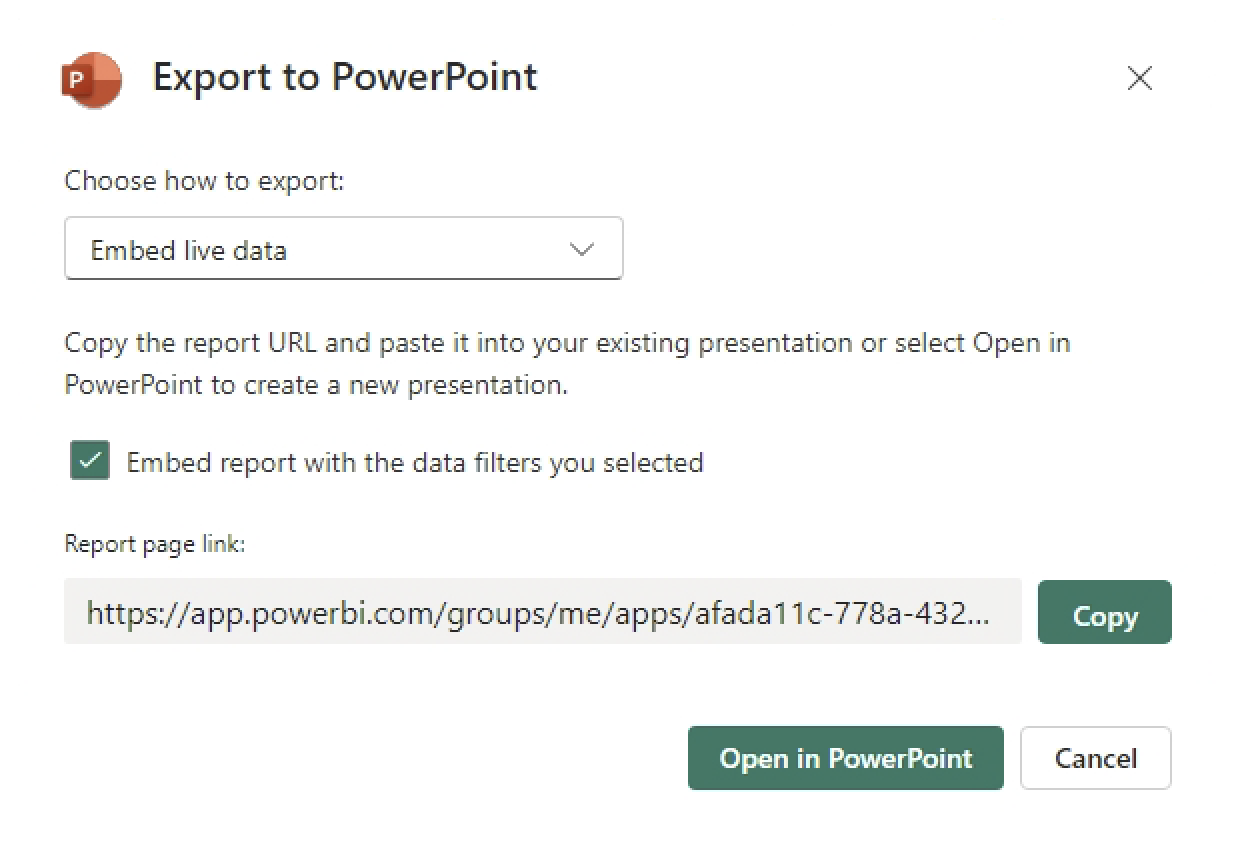
- On your report, click Export, then PowerPoint and choose Embed live data
- This will generate a PowerPoint file containing a linked version of your Power BI dashboard
Limitations
Reduced Formatting Flexibility
The linked Power BI visuals offer less formatting flexibility within PowerPoint. For example, it is hard to crop the dashboard to show specific visuals, and each visual has the filters and Power BI footer attached to it.
Collaboration Roadblocks
When collaborating on a report in PowerPoint, every co-author must have permission to access the original dynamic report in Power BI. If they don’t, they will need to request access, creating a roadblock in your team’s workflows. This is especially important when sharing your report to stakeholders or reviewers without a Power BI license.
Option #3 – Copy and Paste a Power BI Visual into PowerPoint
The third option to link from Power BI to PowerPoint is to copy a visual from Power BI and paste it into PowerPoint. This is useful for highlighting some elements of a Power BI dashboard without downloading all the pages.
Already tried this method? Skip to Option #4 – Export Power BI Data to PowerPoint via Excel
How to Use this Method
- Open a PowerPoint file on your desktop
- Within Power BI online, open a report published on one of your workspaces
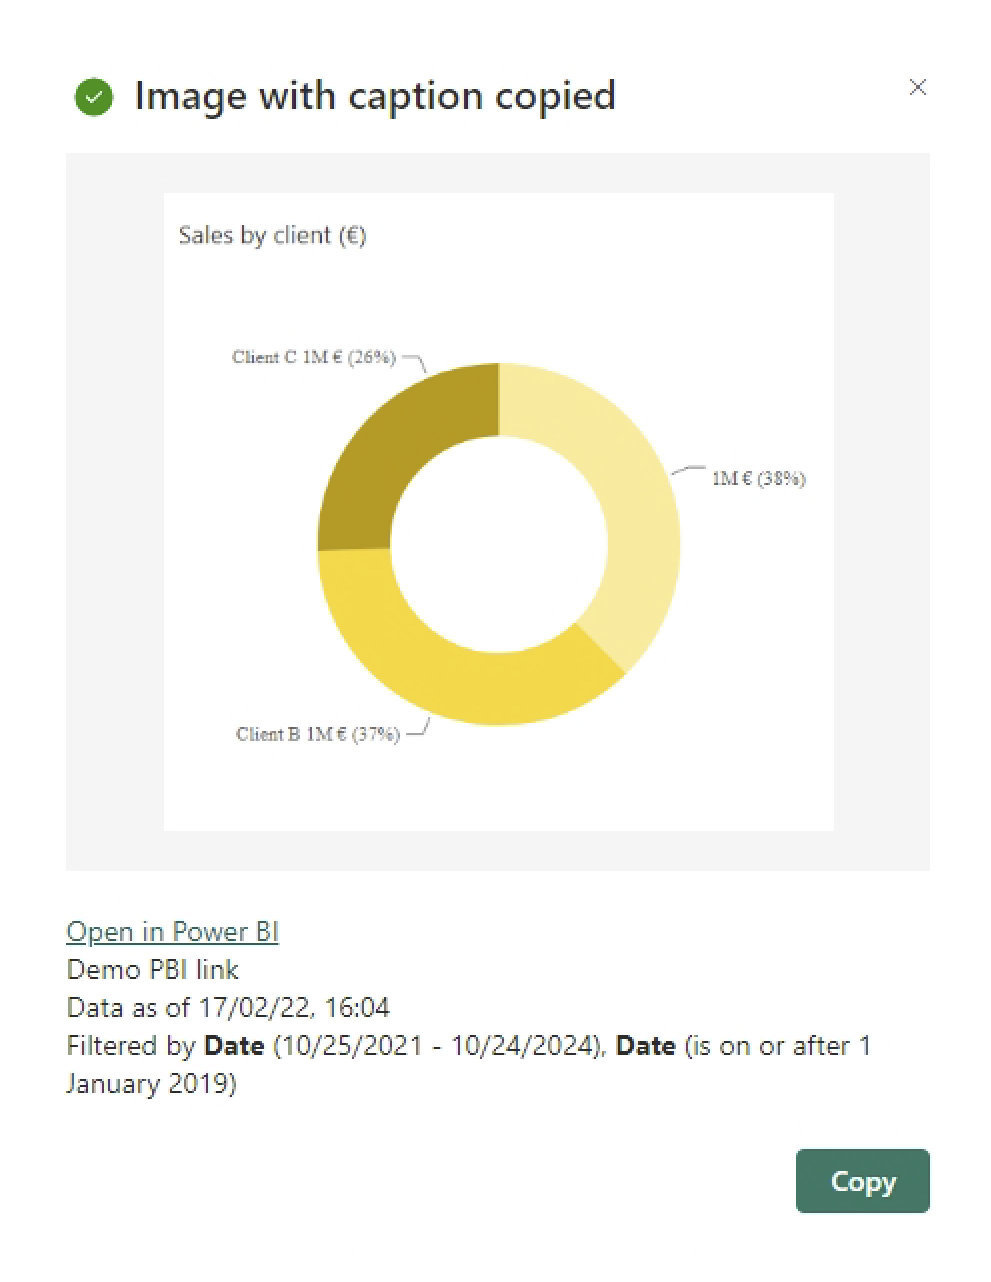
- In the popup window, click Copy to clipboard
- You can now return to your PowerPoint presentation and paste the visual on the slide of your choice
Limitations of Copying and Pasting Power BI Visuals to PowerPoint
Manual Data Updates
With this method, you can’t refresh the data from within PowerPoint. With each change to your figures, you would have to return to Power BI and repeat the process.
Unnecessary Slide Formatting
The visual remains an image accompanied by a text box detailing the source – this should be manually deleted from your slide unless essential.
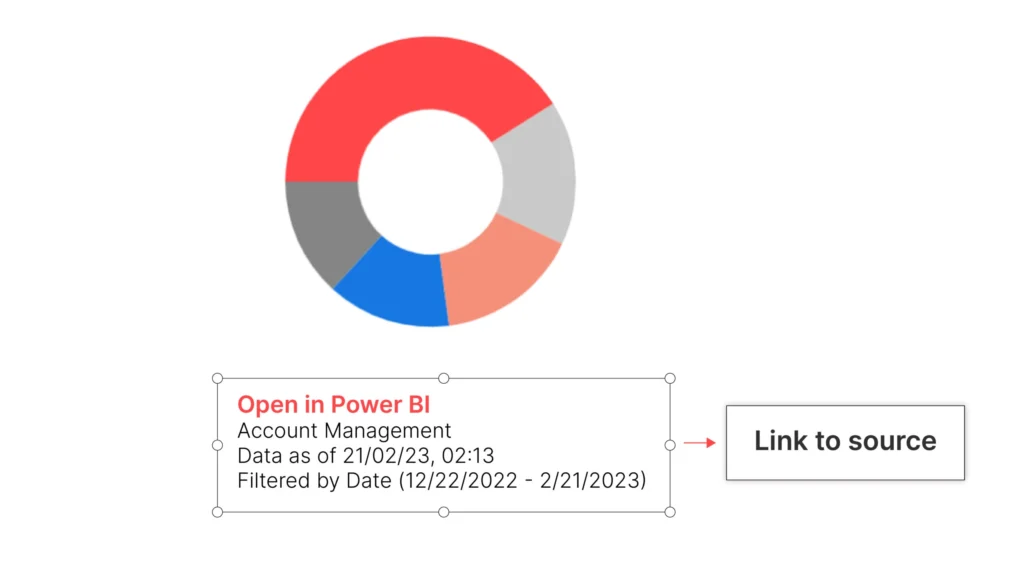
Note: you can keep the hyperlink in the “notes” section to come back to this Power BI visual later.
Option #4 – Export Power BI Data to PowerPoint via Excel
There are certain scenarios where exporting Power BI visuals to Excel, then PowerPoint, might make sense for finance professionals. For example, it is easier to filter and isolate data within Excel rather than relying on Power BI’s default visualization settings when creating tables and graphs.
This technique allows you to combine data from multiple sources that might not be connected to your Power BI dashboard.
Don’t need to use this method? Skip to Option #5 – UpSlide’s Unbreakable Power BI to PowerPoint Link
How to Use this Method
- Within Power BI online, open a report published on one of your workspaces
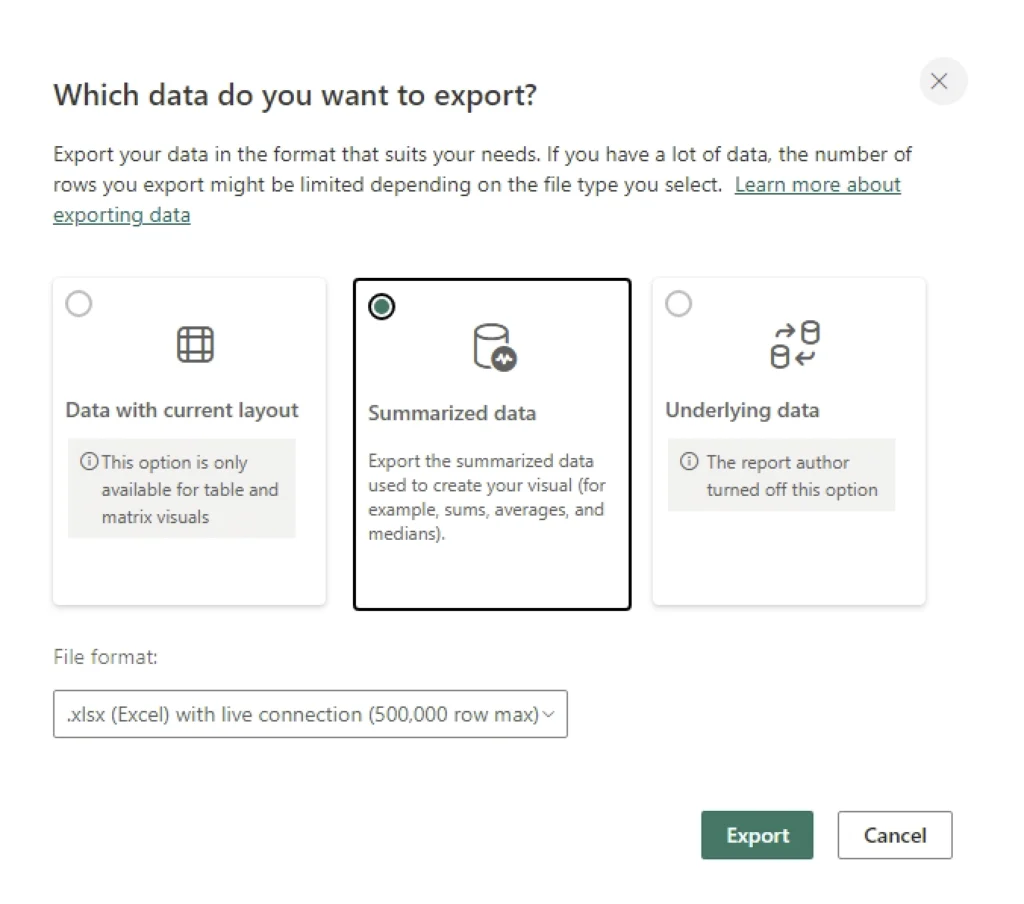
- Select a visual, click on the … icon, then select Export data
- In the pop-up window, keep the default options (Summarized data and .xlsx file)
- Retrieve the raw data Excel file from your downloads
- Edit your table or chart in the Excel file, then link it to your PowerPoint presentation
Discover the quick and easy way to link Excel to PowerPoint >
Limitations
Repetitive Data Updates
Customizing the data in Excel before adding it to your PowerPoint can offer more flexibility than copy and paste. However, this technique is still time-consuming, and you must repeat the process each time your Power BI data evolves.
Inflexible Data Filtering
This last method does not allow you to filter or update your Power BI data from within PowerPoint, essentially adding another step to your reporting workflow.
Only use this method if you are more proficient at data transformation in Excel than Power BI, or if you need to consolidate data from several sources before exporting to PowerPoint.
Discover the quick and easy way to link Excel to PowerPoint >
Option #5 – UpSlide’s Power BI to PowerPoint Link
UpSlide’s Power BI to PowerPoint Link was designed specifically for finance teams. It is the easiest way to connect the two platforms, removing many of the limitations described above.
Access and import Power BI reports directly from within PowerPoint without having to go through Power BI online. The link also allows you to export Power BI visuals to Word.
The Advantages of UpSlide’s PLink
As your data changes over time, you can easily update one or more visuals in a few clicks using our Update Links button. Plus, you can customize the data overview within PowerPoint by editing the categorical slicer values for one or more visuals from a dedicated dropdown menu.
Unlike Microsoft’s native option to embed live data within PowerPoint, this link does not require co-authors to have permissions for the original Power BI report, ensuring smooth collaboration during the reporting process. UpSlide’s link is also guaranteed not to break if the original source file changes name or location, or if you duplicate the static report in PowerPoint.
How to Link Power BI to PowerPoint with UpSlide
- Within the UpSlide ribbon in PowerPoint, click the Import Visual button
- Select a Power BI report from the pane that appears
Note: if this is your first export, you will have to log in to Power BI first - Select your desired visual and click on the … icon, then click Export to PowerPoint. If you want to export the full report, click directly on Export Page at the bottom of the window
Congratulations! In just three clicks, you’ve successfully connected your Power BI report to your PowerPoint presentation.

Note: this option requires an UpSlide License. Discover more about UpSlide’s Power BI to PowerPoint Link.
How to Refresh Your Power BI Data with UpSlide
Follow these steps to refresh your Power BI visuals directly from within your PowerPoint presentation:
- Within the UpSlide ribbon in PowerPoint, click the Update Links button
- In the pane that appears on the right, select the links you want to refresh
- Click on the Update button
Just like that, you have updated the Power BI visuals in your presentation without leaving PowerPoint!
Want to narrow the dataset that applies to your visuals? You can also edit the categorical slicer values from within PowerPoint. Discover how >
Ready to Save Even More Time in Your Reporting Workflows?
With 39% of innovation leaders in the sector prioritizing document automation solutions, UpSlide’s Power BI to PowerPoint Link is a perfect example of how automation can save analysts time and increase efficiency in the long-term.
To learn more about our Power BI to PowerPoint and Word Link, get in touch with a member of our team.
More Resources to Streamline Your Microsoft 365 Workflows
For more tips to increase your productivity between Power BI, PowerPoint, and Excel, discover our most relevant blogs on this topic:
- 5 easy ways to make professional financial charts and graphs in Excel
- Avoid easy mistakes in PowerPoint with 8 powerful tips
- 10 PowerPoint productivity tips and tricks
- Learn about our PowerPoint automation features
- How to link Excel to PowerPoint and Save Hours of Time
TL;DR
Discover the five main ways to connect Power BI to PowerPoint – and the limitations of each.
Microsoft’s native solutions are easily accessible, but often lack some of the efficiency benefits of a more specialized reporting automation solution. For example, inflexible formatting or unnecessary steps for making data updates.
For a one-click solution to efficiently export Power BI to PowerPoint, use UpSlide to create dynamic reports that clients and stakeholders will love.


