Ever wondered what the Microsoft 365 add-in Power Query is and how it works? If so, you have come to the right place.
Read on to hear from Pauline Jouffret, our Power Query expert at UpSlide, and understand how to master the basics of this data transformation and preparation tool.
Discover Power Query
What is Power Query?
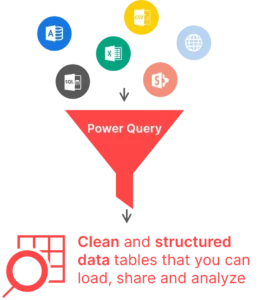
Power Query is an ETL (Extract-Transform-Load) tool, dedicated to data transformation and preparation, within Microsoft 365. Because of its low-code interface, Power Query is an excellent tool to combine and transform data without the help of your IT department. It gives power and flexibility to end-users, saving you money and resources.
If you already know what Power Query is, skip to section 4: How to use Power Query
When to Use Power Query:
- Processing large amounts of data
- Importing data from different sources (e.g. Excel, CSV, SharePoint, SQL, and Salesforce)
- Cleaning, transforming and combining data according to your needs without coding
- Repeating regular data transformations, for example, in a monthly report
The Benefits of Power Query:
Power Query offers several benefits, especially for those who work with data regularly. Here are some key advantages:
1. Low-code Interface
Clean, merge, append, and group data easily. Power Query provides a user-friendly interface to perform complex data transformations without needing to write code. However, you can enhance your data queries using Power Query’s dedicated M language.
2. Data Integration
Power Query allows you to connect to various data sources, such as Excel tables, CSV files, databases, and even web pages. This makes it easier to consolidate and analyze data from multiple sources and ensures that everyone in your organization is working with the same, up-to-date information.
3. Efficient Recurring Transformation
Power Query remembers the steps you take to transform your data, making it easy to repeat the process with new data sets – for example, when creating recurring reports. Once you set up your query, you can refresh it with new data, and it will automatically apply the same transformations.
4. File Size Optimization
Though Power Query pulls data from multiple sources, it doesn’t change the original data source. The outcome is like a snapshot of reshaped data brought to Excel. Since the source data is not directly imported, it does not make your Excel file heavier (i.e. it doesn’t slow down your computer).
> Discover 8 easy ways to reduce your Excel file size

Power Query is the perfect solution if you don’t have a data engineer within your organization. The low-code interface means that anyone can transform data with very minimal training.

Pauline Jouffret
Data Engineer

Power Query vs Power BI
What is the Difference Between Power Query and Power BI?
Power Query is part of Power BI. It’s the first step of a BI project where you want to ETL your data, calculate key metrics and present them in charts.
The interface of the Power BI Desktop software allows you to benefit from three technologies (Power Query, Power Pivot and Power View). With Power BI, you can do all the steps of the data analysis chain, from extracting data to creating visuals on an interactive dashboard that you can share and analyze.
>Discover UpSlide’s Power BI to PowerPoint or Word Link
Where do Finance Teams use Power BI?
Where Power Query is largely used as an ETL solution, Power BI is a valuable data visualization tool. Finance teams use Power BI to represent the data that has been through an ETL tool, as complex, interactive tables and charts within a dashboard. When presenting this data to stakeholders and clients, they typically export it from Power BI to a PowerPoint presentation or Word document.
> Discover four ways of exporting Power BI to PowerPoint
Common Questions About Power Query
Is Power Query a Good Alternative to Excel VBA?
Power Query can easily replace VBA (Visual Basic for Applications) as it enables you to:
- Process your tables simply by clicking on buttons. Plus, no coding skills are needed!
- Visualize your operations step-by-step without running a single macro.
- Easily edit the order of steps by dragging and dropping! Plus, you can add and delete unnecessary steps with a simple click.
However, Power Query can’t replace VBA when it comes to interacting with Excel’s interface, automating processes, generating new files, and sending emails.
Is Power Query Free?
Yes. Power Query is a free extension of Excel and Power BI. Within Power BI, Power Query can also be called Power Query Editor.
Is There a Power Query for Mac?
Yes. Power Query is also compatible with Excel for Mac. If you’re a Microsoft 365 subscriber, the Power Query experience is available in Excel for the Mac from the Get Data command on the Data tab. Once enabled, Power Query functionality is available from the Power Query tab on the Excel ribbon.
Do I Have to Download Power Query?
Power Query is a free add-in for Excel 2016 and beyond, as well as a built-in Excel feature for Microsoft 365. If your organization uses those versions of Excel, you do not need to download Power Query.
Where do I Find Power Query in Excel?
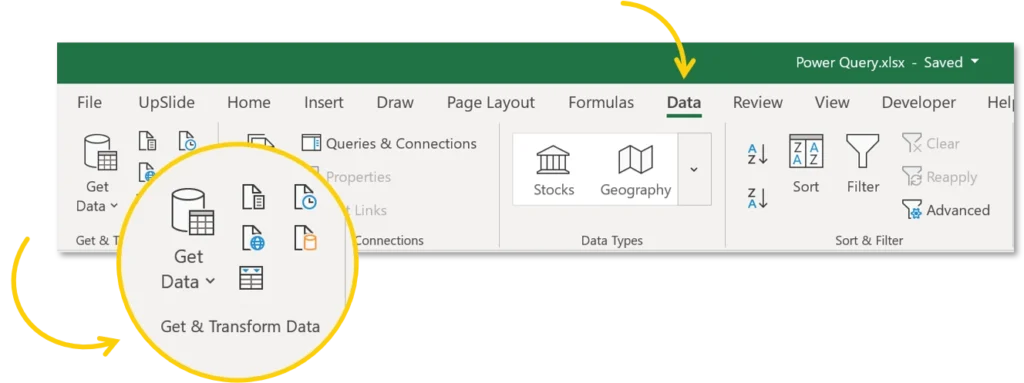
Within the Data tab in Excel, simply click the button named Get Data on the left-hand side of the ribbon, under the Get & Transform Data section.
How to Use Power Query
How to Use the Power Query Editor in Excel
You can open the Power Query editor by clicking on transform data. It will open in a separate window. Here’s how to navigate Power Query and what you’ll find in each tab:
A View of the Queries & Connections Pane
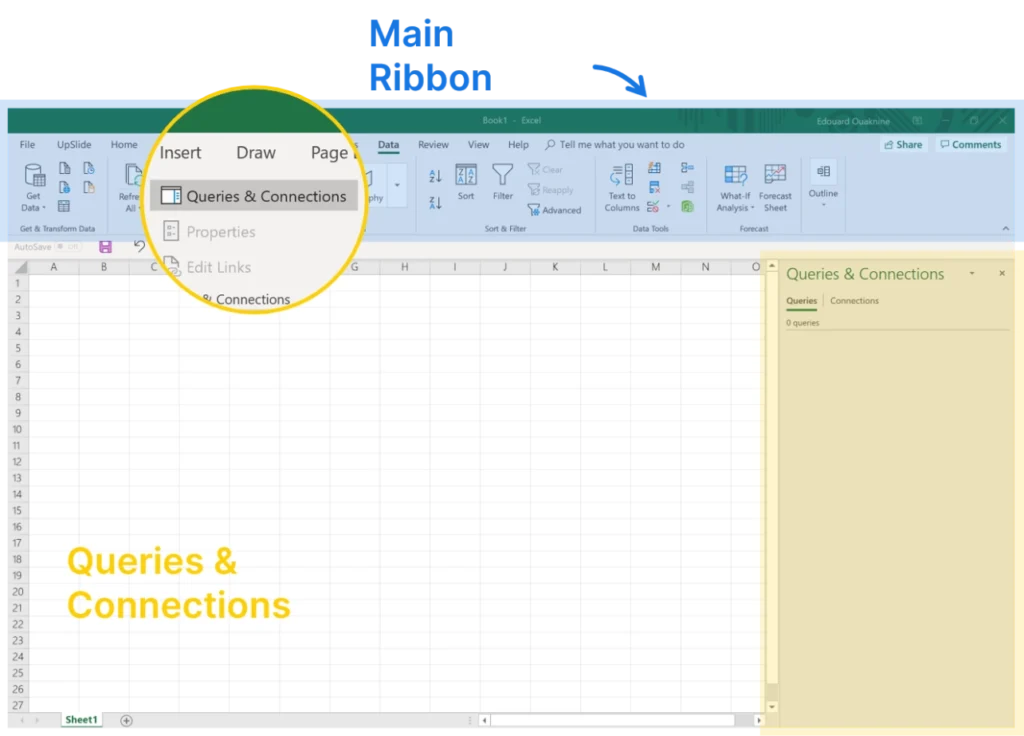
The Queries & Connections pane is composed of two parts:
1. Data Ribbon
Navigate to the Data ribbon to search through multiple data sources.
2. Queries and Connections Pane
Have a quick look at all of the connections (queries) you made.
Top Tip:
If you are regularly cleaning and transforming data in Excel, we recommend pinning the Power Query Editor to your quick access toolbar in Excel.
A View of the Four Parts of the Power Query Editor
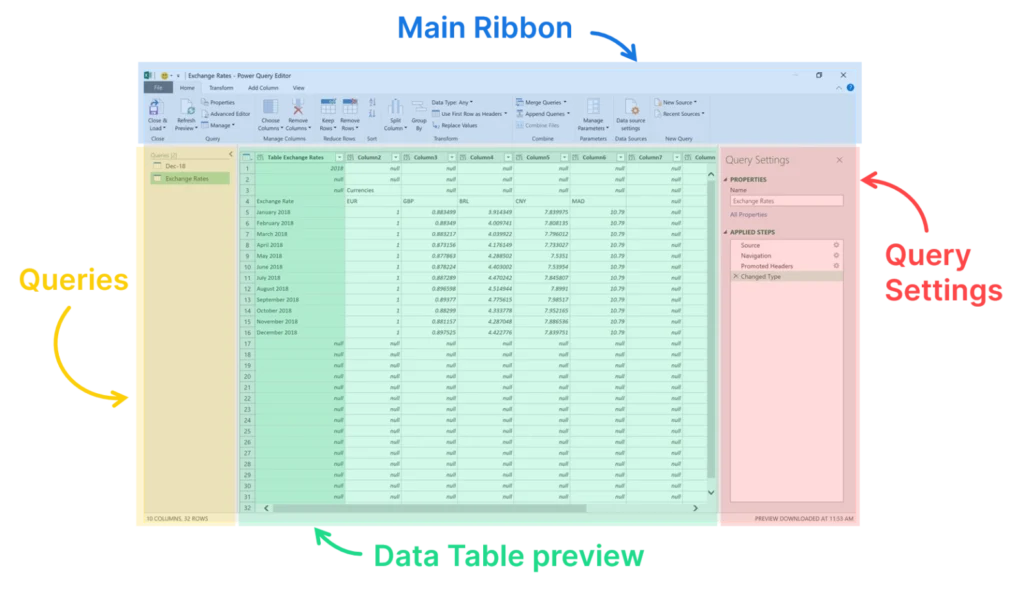
Once you launch Power Query, you land on the Power Query Editor which is made up of four distinct elements:
1. Main Ribbon
Create queries from scratch thanks to its buttons. If you are familiar with the M language, you can also access the Advanced Editor to tweak them manually.
2. List of Queries
Keep track of all connections to data sources and streams via the Queries list on the left of the window.
3. Data Table Preview
Use the Data Table preview to visualize the data results after a specific transformation step is complete.
4. Query Settings (Applied Steps)
Navigate through all the steps you made when transforming your data. Power Query automatically records all transformations made.
What to Consider When Using Power Query
As you enter the Power Query interface, you will no longer be able to interact with Excel. If you need to return to Excel, you will have to close the Power Query editor.
The Microsoft Power Query add-in for Excel 2010/2013 is no longer being updated by Microsoft. If you are using Excel 2010/2013, you should upgrade to a newer version of Excel to use Power Query.
Continue Learning About Power Query
To discover more about how Power Query can improve data transformation and analytics within your organization, see the resources below.
For more tips on how to boost your efficiency within the Microsoft 365 suite, bookmark our Knowledge Hub or follow us on LinkedIn.
Top Resources to Learn More About Power Query
- How to automate data tasks in Excel using Power Query – Excel Campus
- How to use Microsoft Power Query – Kevin Stratvert
- How Power Query will change the way you use Excel – Leila Gharani
- Power Query challenges – Ken Puls
- Combine Excel Files with Power Query – Miguel Escobar
Top UpSlide Resources for Business Intelligence Teams
- How Thales’s procurement BI team guarantees data reliability with UpSlide
- How BNP Paribas’s management control team optimizes recurring report creation with UpSlide
- How to link Power BI to PowerPoint and Word
TL;DR
Power Query, in Microsoft 365, empowers users to transform data easily without IT assistance, combining sources, cleaning, and reshaping data without coding.
It acts as an ETL tool, letting you work with vast data sources without changing the original, thus keeping Excel files lightweight and efficient.
The four key elements of the Power Query Editor are: the main ribbon, queries, data table preview and query settings.
