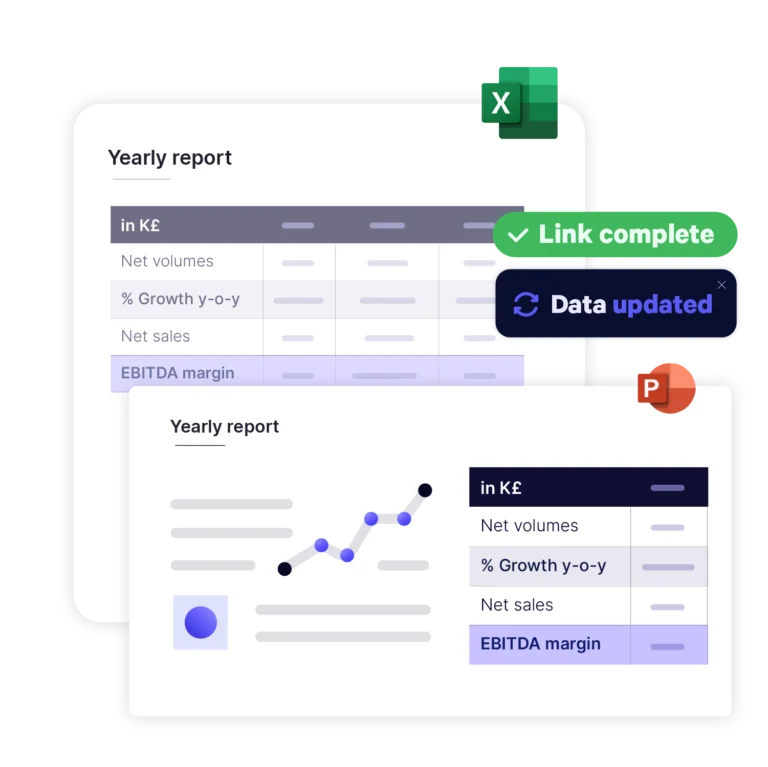
Guarantee Brand Compliance with UpSlide's Formatting Features in Excel

Save Time Building Reports
single click.

Tell Better Stories with your Data
as possible.

Maintain Brand Consistency
Guarantee every table and chart is built per your company’s standard dimensions and color scheme.


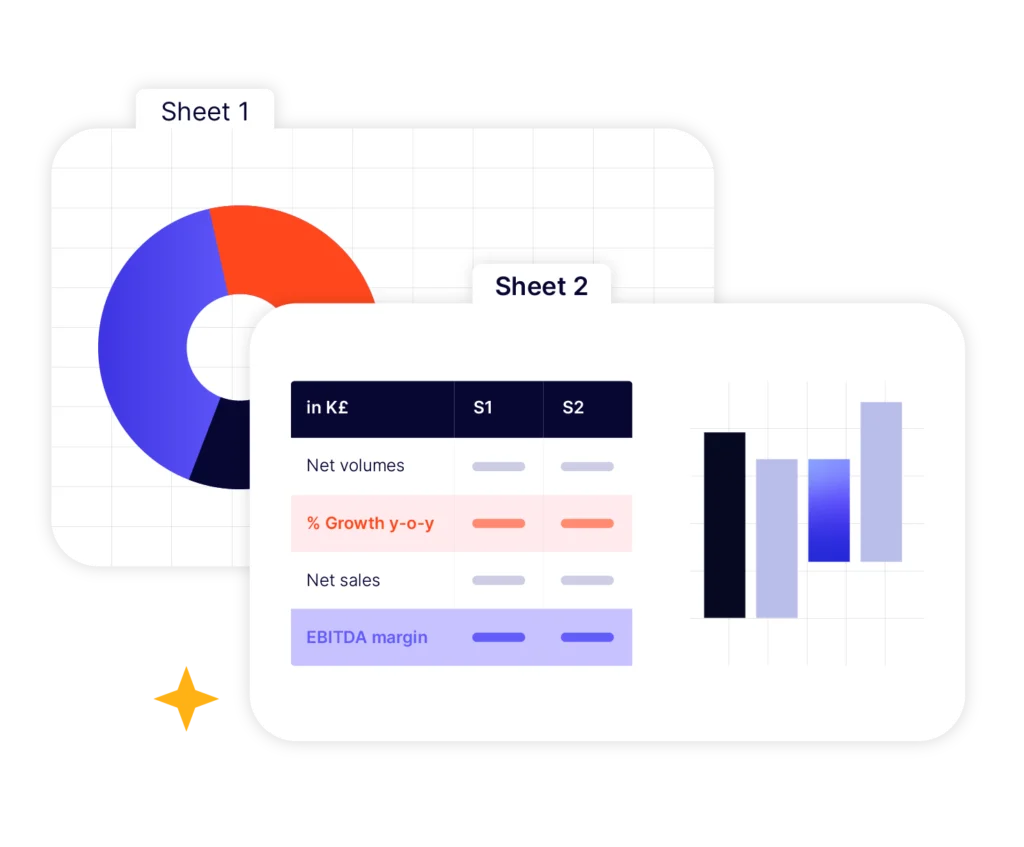
Format Excel Charts in One Click
Say goodbye to manual formatting in Excel. Apply consistent branding and dimensions to waterfall charts, pie charts, pivot tables and more.
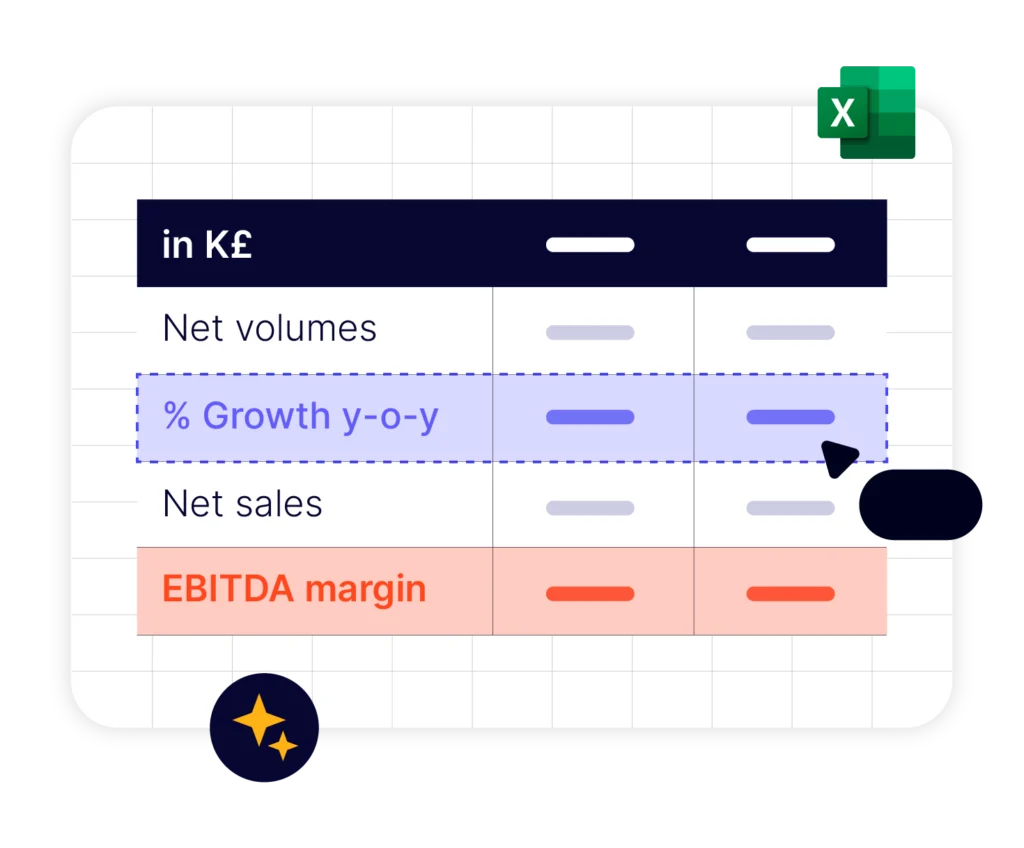
Customize Workbooks to Enhance Your Messaging
Highlight selected rows in your tables thanks to pre-set background colors, borders and fonts. Build impactful charts and well-structured tables to make information much clearer for your clients.
The Excel chart formatting features have been key in empowering teams to create brand-compliant reports, quickly and easily. With UpSlide, we can apply our brand formatting to any graph or table with a single click.
Jennifer Bailey, Operations Manager, Valuation & Advisory Services, Colliers


The ability to format the line styles and numbers according to our branding and specific needs is very helpful. UpSlide makes it easier to maintain consistency between different reports.
Erin Sutton, Operations Manager, PKF


Before UpSlide, everyone had their own process, so the deliverables were inconsistent. Now we’re all following a single process and using one central tool, documents are much more consistent.
Anthea Cumming, Head of Creative Services, Campbell Lutyens


Make Reporting Even Easier for Your Teams

Our Microsoft 365 Expertise
helping teams work better in Microsoft 365

average renewal rate
Frequently Asked Questions
Can I Get Support on this Feature?
Yes. With every UpSlide roll-out we offer a dedicated program of adoption training and support. We also publish technical guidelines for all of our features on our support site.
How Does this Compare to Native Microsoft Functionality?
We built UpSlide features to answer the specific needs of professionals working heavily in Microsoft 365. While Microsoft offers an array of brilliant native functionality to help format tables and charts in Excel, UpSlide’s Excel Formatting Features offer an enterprise-wide solution to build brand-compliant tables and charts in just a few clicks.
How Secure is UpSlide?
Leading financial firms trust UpSlide thanks to our stringent security measures. We successfully completed a System and Organization Controls (SOC) 2 Type II audit, reflecting our commitment to the highest standards of security, availability, processing integrity and confidentiality.
We perform a security audit of our code before every release, use automated and manual testing to ensure each version meets strict quality and security standards, and integrate vulnerability management tightly within our development processes. UpSlide also integrates within your infrastructure, enabling you to keep full control of it. Even if you choose to use a cloud source for your library content, we still have zero visibility of your data.
How Much Does UpSlide Cost?
UpSlide prices depend on the number of licenses you require, the options you want and your setup model. The Power BI Link is an optional module and isn’t part of our standard offer. If you want to know how much UpSlide would cost for you, please get in touch with us, and our team will be happy to give you a personalized quote.
Can I Get an UpSlide Trial?
As UpSlide is a completely customized solution, we tailor our technology to your unique needs and brand, so you get a high ROI. Therefore, we don’t typically offer free trials. However, we do recommend having a chat with one of our experts to discuss your challenges in Microsoft 365 to see how we can help you achieve your strategic goals.
