Building high-quality reports under tight deadlines is a familiar challenge for any reporting team, and the Marketing team at TotalEnergies is no exception. We spoke with Salomé Knafo, Partnerships and Roaming Manager at TotalEnergies, to find out what document creation looks like for them, and how they ensure data accuracy and high quality with UpSlide.
The Challenge: Inefficient, Manual Report Creation
For Salomé’s team, their monthly reports are the primary way to update internal stakeholders on their business activity. Sent to around 100 people, these reports are usually around 70 slides, and quality and accuracy are paramount. In a typical report, the team would have to pull data from a range of sources, stored in both Excel and Power BI, while ensuring all data points are accurate in the final deliverable.
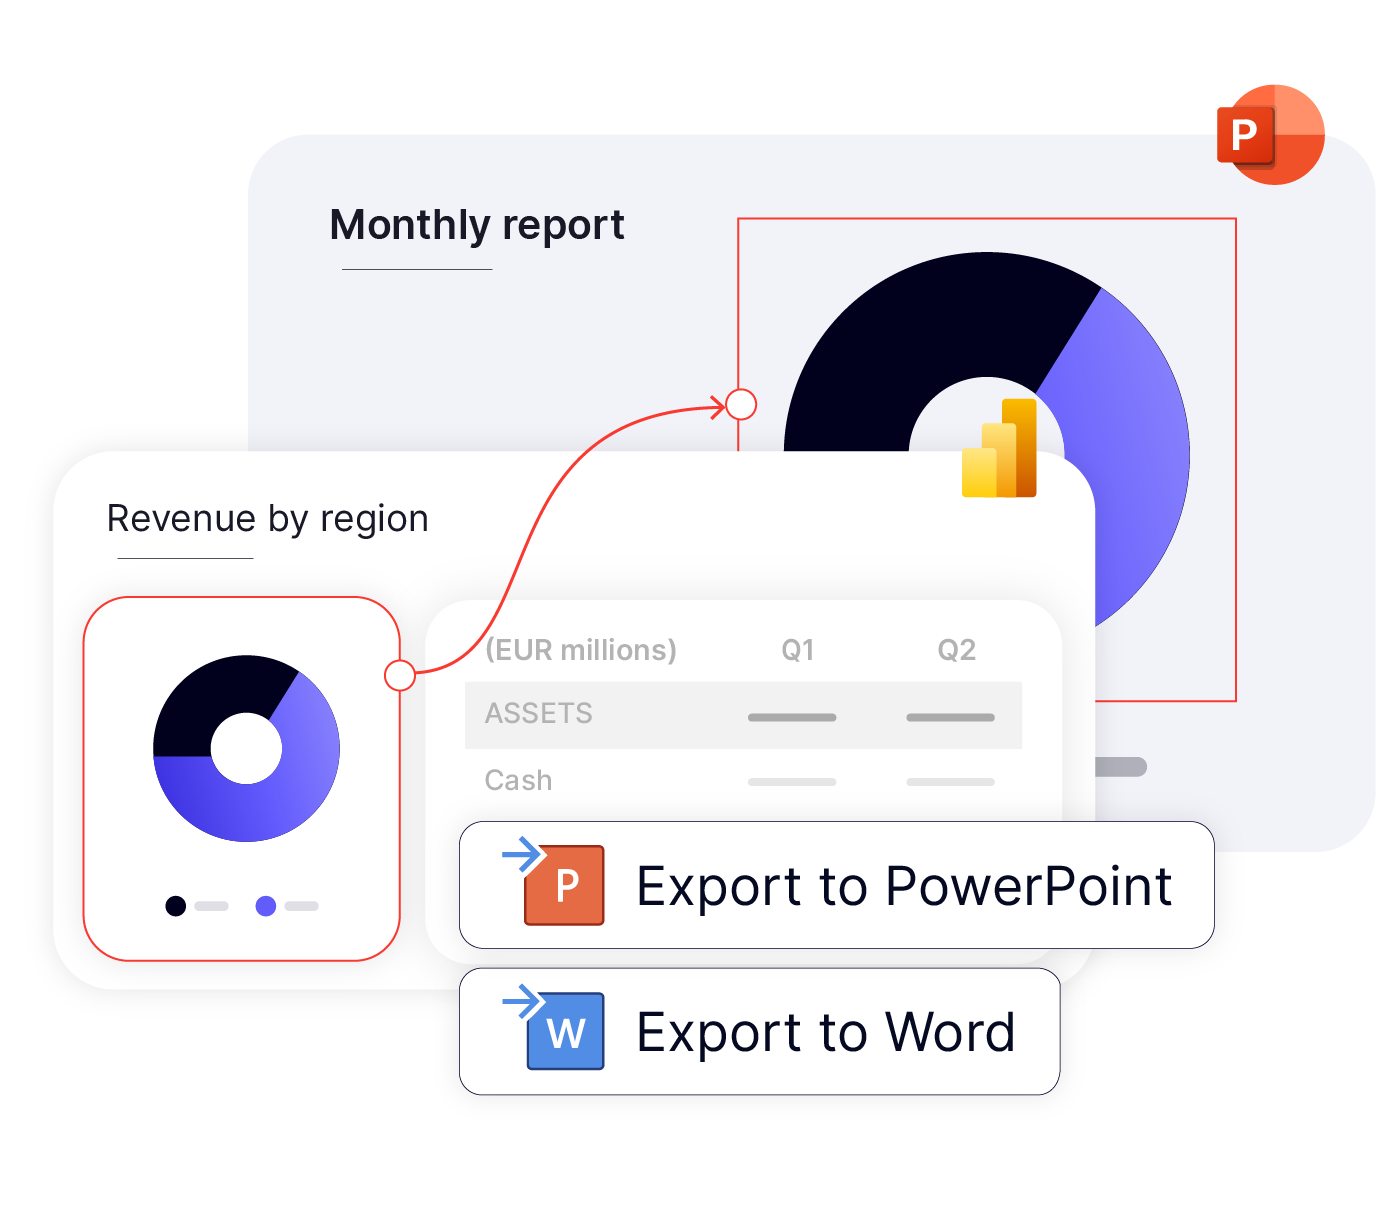
Without a dedicated reporting tool, each report would take over a week to produce, with hours spent checking the figures and formatting across the deck. The excess manual work would often leave the team feeling stressed and uninspired.
Choosing UpSlide
The marketing team needed a tool to guarantee the accuracy of their reporting data, and ensure their decks were produced to a high standard.
UpSlide had been helping TotalEnergies make data exports from Excel to PowerPoint more efficient since 2014. The tool was first deployed in their exploration and production (E&P) team, gradually expanding into their investor relations, finance and marketing teams.
From the tool’s successful track record at TotalEnergies, Salomé’s team was recommended UpSlide by a colleague in 2022 to help them report on the performance of marketing initiatives and KPIs.
Her team now uses UpSlide on a monthly basis to automate these recurring reporrts.

The monthly reports used to take up a lot of my capacity; now, with UpSlide, the hours I save become hours that I can focus on other, more fulfilling tasks.

Salomé Knafo
Partnerships and Roaming Manager
Three Ways TotalEnergies Streamlines Their Report Creation with UpSlide
Linking and Updating Hundreds of Data Points in Seconds
In a report that pulls hundreds of data points from multiple source files, the quantity of manual updates required to keep the figures up-to-date was frustrating for Salomé and her team.
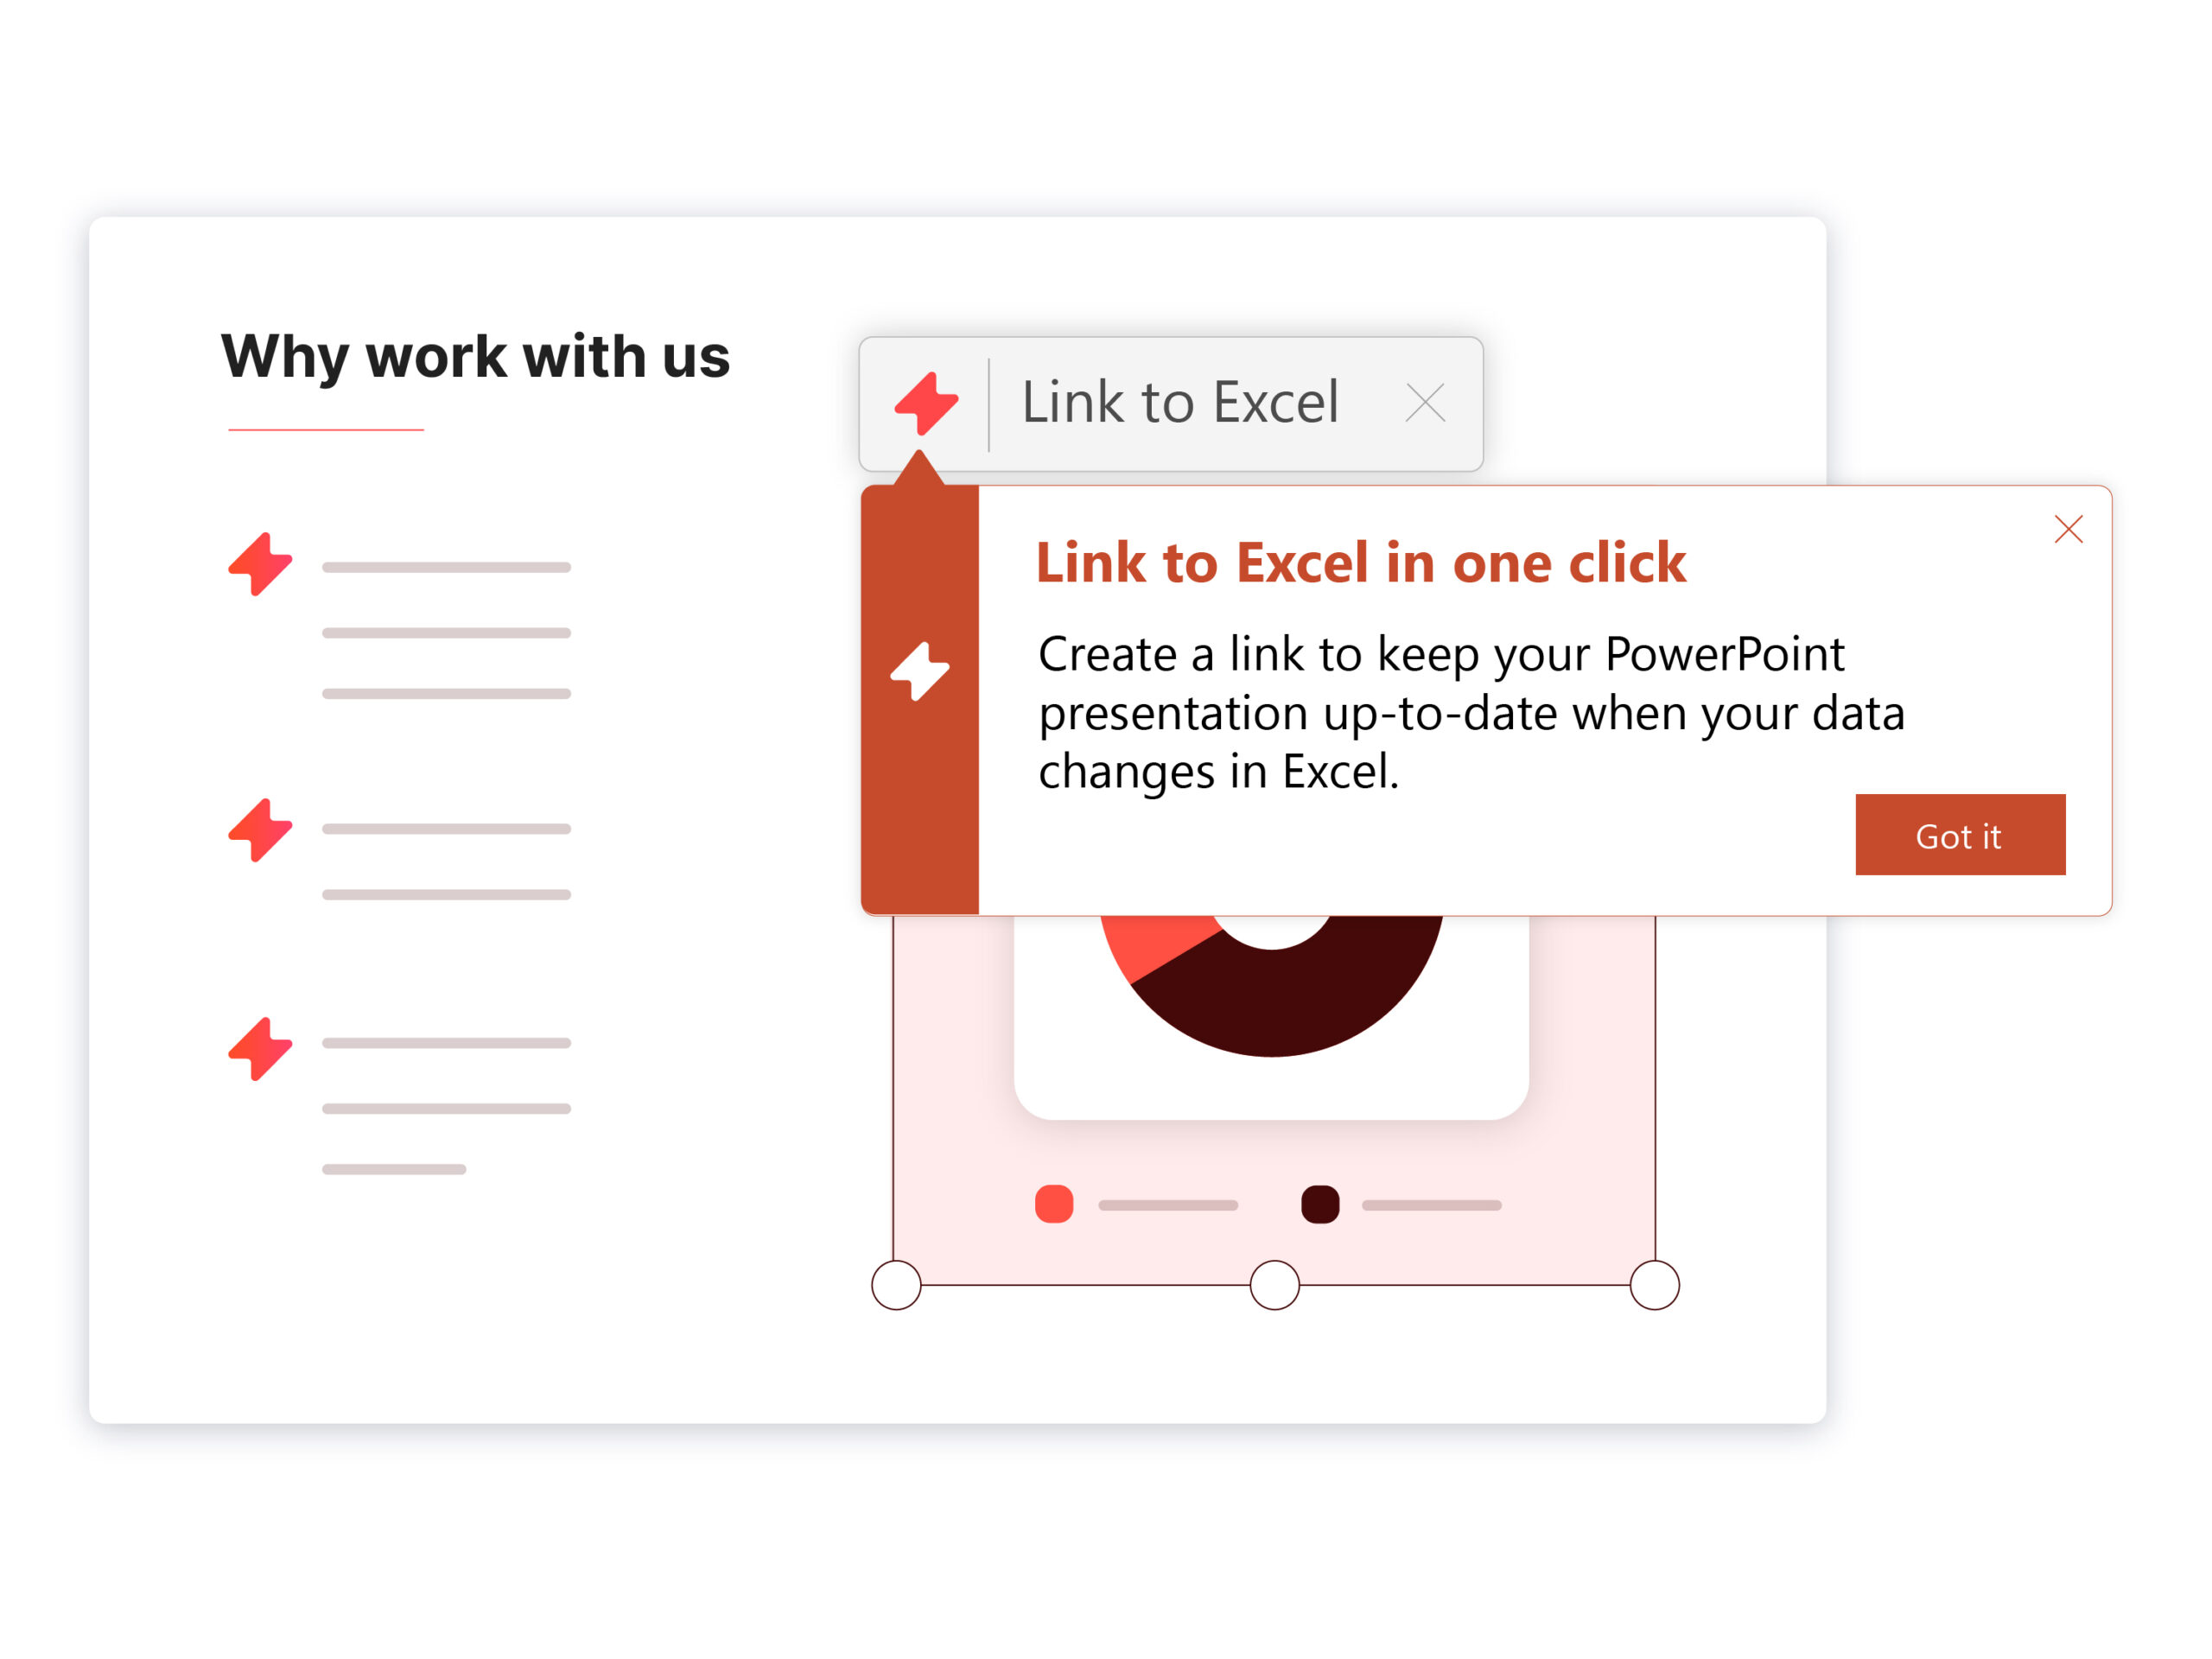
“Before using UpSlide,” Salomé explained, “we would take screenshots from Excel whenever we wanted to present that information in PowerPoint. It was a waste of time as whenever the original data was updated, we had to go back and change it slide-by-slide in PowerPoint.”
“Now, we can update all data in the final deck with one click using the Excel Link button in my UpSlide ribbon.”
Making the Proofreading Process more Efficient and Accurate
A typical report produced by Salomé’s team is comprised of over 70 slides, so checking the formatting and accuracy of the slides was a significant task.
Maintaining consistency would only get harder as the number of collaborators increased: “for the monthly reports, we would have different people building the slides and, if you don’t pay attention, someone is going to write in Arial and the other one is going to write in Calibri.”
“When you’ve been immersed in these reports for hours, you don’t always see the differences from one slide to another. You can reread your own slide, but because you’ve been building this report for a week, you don’t even see the mistakes in front of you.”
UpSlide’s Slide Check feature transformed Salomé’s proofing process, saving her precious energy and time when deadlines loom. “I now use Slide Check at the end of the report when everything’s done. It cuts close to an hour off my reviewing time, and it sets my mind at ease before I share the report internally.”

Sourcing Up-to-Date and On-Brand Corporate Materials
As the marketing team’s reports are typically sent to over 100 internal stakeholders, it is essential to present their data to a high standard, in-line with TotalEnergies’ brand guidelines.
“The Content Library is great for adding those final branding touches to the reports after the data is finalized,” Salomé comments. “We have a toolbox of images, icons, maps, and flags that we can access directly within PowerPoint, all in the TotalEnergies brand.”

UpSlide is a really intuitive reporting tool. Integrated into my PowerPoint ribbon, my entire reporting process can be automated: from data updates to formatting logos.

Salomé Knafo
Partnerships and Roaming Manager

“These are probably the three most useful features for my reports,” Salomé reflects, “and when I want to hear about new features that could make my reporting more efficient, UpSlide’s quarterly newsletter is my main source of knowledge.”
The Result: Accurate, Stress-Free Quarterly Reporting
Over a year into their time with UpSlide, Salomé’s team are now building reports to a high standard, with maximum efficiency. Not only is their data well-presented, in line with TotalEnergies’ branding, but the team can remain confident knowing that they are always presenting the most up-to-date figures.
“When you send reports to a lot of people, it can be pretty stressful because you know that there is a lot of data to work through. UpSlide really helps take that pressure off my mind.”
A stress-free team is ultimately a more productive one. Salomé has since found that she has more time to spend on other value-added areas of her role. She adds, “I’ve recommended the tool to other people across the business to help with their reporting, too.”
Discover how UpSlide helps other corporate teams save upward of 21+ hours per month.

