Looking to export Power BI data to Excel?
Explore our top four recommendations to improve your workflow and export data more efficiently. From using ‘Analyze in Excel’ to creating PivotTables, we’ll delve into the benefits and limitations of each method.
Common Use Cases for Exporting Power BI Data to Excel
Power BI is being used more and more within financial services; however, times may arise where you will need to export Power BI to Excel.
Sharing Data With Stakeholders:
Stakeholders, clients, or colleagues might want to view the data behind a report, but they might not work regularly within Power BI. A quick fix is to export the data to Excel and then share the workbook with the colleague or client.
Examining Raw Data in Excel:
If you want to drill down into the data behind your Power BI visualizations, you may wish to export Power BI datasets to Excel using Power BI’s ‘Analyze in Excel’ feature.
How to Export Data From Power BI to Excel
Method 1: Build Refreshable Reports in Excel With Power BI’s ‘Analyze in Excel’
This method of exporting data from Power BI to Excel can handle whole data models, plus it offers the advantage of being able to refresh the data directly in Excel.
This will help when you want to export large amounts of data and drill down into the individual data points away from Power BI’s visualizations.
How to Connect Your Power BI Data to Excel With the ‘Analyze in Excel’ Function:
- Go to Power BI.
- Open the report which contains the data set you want to export.
- Click ‘Export’ within the top ribbon.
- Within the dropdown, select ‘Analyze in Excel’.
This downloads an Excel file in OneDrive, enabling you to view the workbook in Excel for the web. From here you can create PivotTables, visuals, etc. directly in Excel from the data derived from the Power BI data cube.
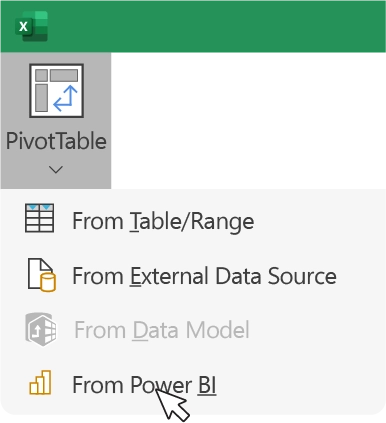
For example, when you want to create a new PivotTable in the Excel file (‘Insert’ > ‘PivotTable’ tab), simply choose ‘From Power BI’ and then connect to the desired dataset from the right-hand pane.
To refresh the data from the Power BI report, simply go to the ‘Data’ tab and click on ‘Refresh All.’
Limitations:
- It generates a new file with an unfamiliar extension (.ODC, while Microsoft recommends to use the .XLSX extension).
- Measurements from data models must be created beforehand as it is not possible to create them in a PivotTable.
> Discover 8 ways to make beautiful financial charts in Excel

Power BI’s ‘Analyze in Excel’ function gives users control and allows them to export large volumes of data at once.

Roxanne Vals
Senior Consultant

Method 2: Export Data From a Power BI VIsual to Excel With ‘Export Data’
Within your dashboards in Power BI, you might want to drill down into the datasets behind specific visuals. The easiest way to do this is by exporting select visuals directly to Excel.
How to Export Visuals From Power BI to Excel:
- Go to Power BI and choose a report you have access to.
- Click on ‘…’ at the top right of the desired visual, then click the ‘Export data’ button.
- Choose which data format you’d like to export: with the current layout, summarized data, or underlying data.
- The report author can limit certain options, for example, removing the ability to export as ‘underlying data’.
You can now edit your data or re-make graphs directly in Excel.

Limitations:
- You can only export data in a new CSV file from one visual at a time
- You cannot update the data in Excel as the Power BI report evolves.
- You can only export data related to a Power BI visual. It is not possible to extract a table, because the data and the model cannot be viewed in the published version.
> Discover our top 3 productivity tips to become an Excel champion
Method 3: Create PivotTables by Retrieving Power BI Data From Within Excel
Here’s how to access Power BI data from within Excel:
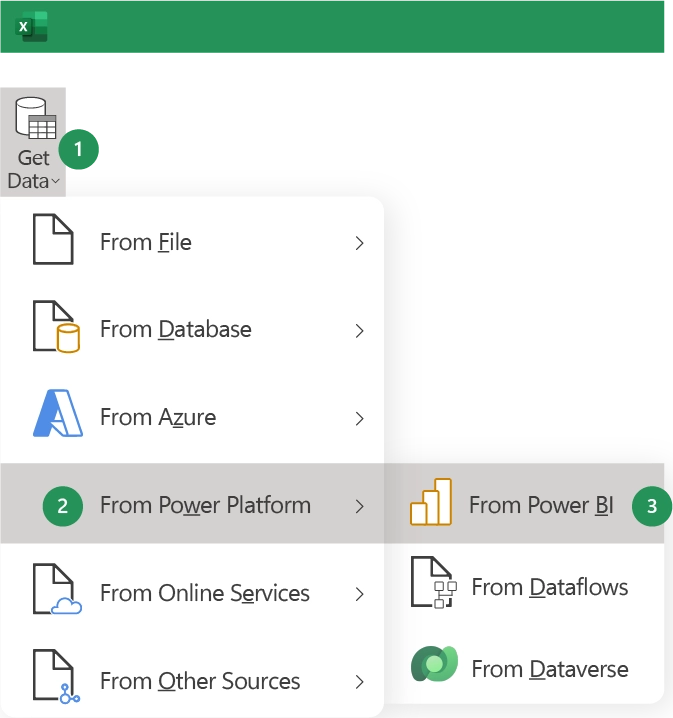
- Go to the Excel ‘Data’ tab and select ‘Get Data’.
- Choose ‘From Power Platform’ in the drop-down menu and then ‘From Power BI’.
- Select a dataset from the right-hand pane to create a PivotTable in Excel.
- Choose fields from the PivotTable Field List to display.
Limitations:
Whilst this is a quick, easy way to export data from Power BI to Excel, it isn’t the most efficient.
- Selecting fields from a PivotTable Field List can make it difficult to visualize and understand the data set, especially if you didn’t create the Power BI dashboard yourself.
- Clicking through the various PivotTable fields to create your intended table in Excel could cost more time in the long run.
- Plus, it’s difficult to use Excel formulas on a PivotTable, which is limiting when building a report.
> Master 7 ways to reduce your Excel file size
Method 4: Export Tables from Power BI to Excel
There are two ways to export Power BI to Excel as a Table. The first, via the ‘Get Data’ tab in Excel, allows you to be more specific in which data ranges to choose by selecting values and filters; however it can be more time consuming. The second, using copy and paste within Power BI is the more efficient method, but it requires you to manually delete columns and format the dataset within Excel.
First Approach: How to Export Your Power BI Table to Excel With ‘Get Data’
- In Excel, go to the ‘Data’ tab and click ‘Get Data’.
- Similarly to the above option, choose ‘From Power Platform’ and then ‘From Power BI’.
- Choose your dataset from within the ‘Data’ tab in the right-hand pane, and then select ‘Insert Table’.
- Build the table by easily selecting your values and filters.
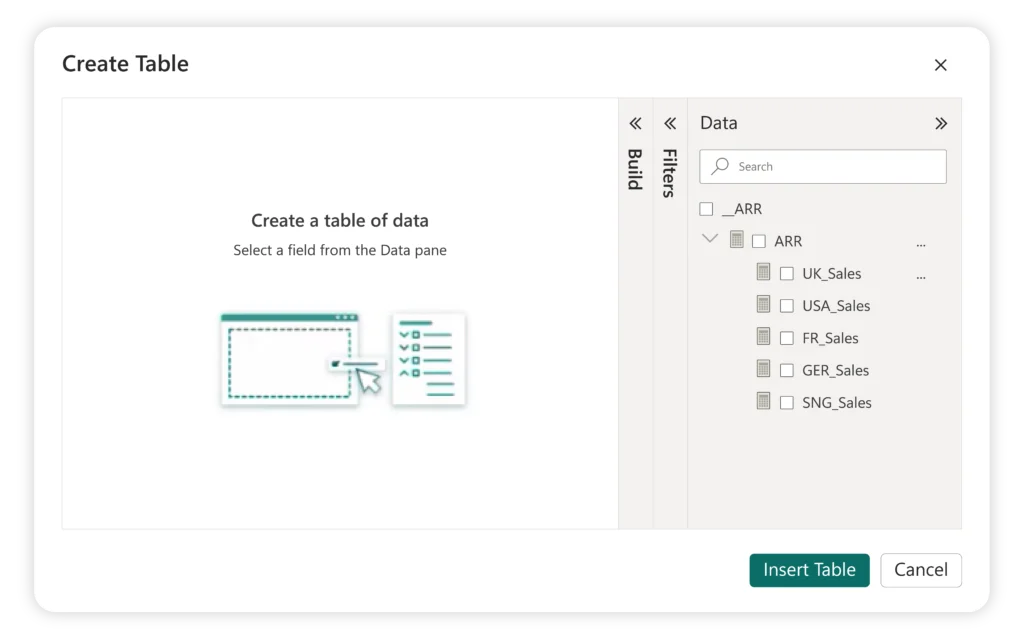
If you’re a frequent Power BI user, this is the more efficient, easy way to ‘Get Data’ from within Excel. The user-friendly pane is more similar to Power BI, making it easier to navigate and preview your table as you build it. Plus, the data output is built as a standard Excel table, meaning you can easily apply formulas, unlike method three.
Limitations
- Unfortunately, there is no easy or quick way to amend your table if you made a mistake when building these tables or if you’d like to edit your values.
- In this scenario, you’d either have to confidently amend the DAX language from within the pane, or start the export all over again.
Second Approach: How to Copy and Paste Tables From Power BI to Excel
Copying a Power BI Table to Excel is much more straightforward.
- Go to Power BI.
- Choose your desired Power BI Table and go to ‘Data View’.
- Right-click on the chosen table.
- Select the option ‘Copy Table’.
- Create a new sheet in Excel and paste the content of the table.
Limitations:
• If the data range you’ve selected contains any unnecessary fields, you will have to manually remove these within Excel, without the flexibility to filter them out pre-export.
• As with the above method, this option is also not dynamic, so you will have to repeat the process should the source data change.
> Discover how to link your Excel data to PowerPoint
Other Power BI Integrations in Microsoft 365
After creating detailed visualizations within Power BI, finance teams will typically present that data to clients or internal management as part of a pitchbook, information memorandum, or portfolio report within PowerPoint.
Microsoft does have a native export function to PowerPoint, however, the capability of this function is quite limited.
However, if you’re a finance professional, there is a more efficient solution. You can export Power BI visuals to PowerPoint or Word using UpSlide’s Power BI Link. This feature allows you to access your Power BI reports and dashboards directly from PowerPoint or Word, choose the visuals you need and insert them into your presentation in a few clicks.

Once your Power BI is linked to your PowerPoint or Word, you can also update your entire presentation or specific visuals with the latest data by simply clicking the ‘Update Links’ button.
UpSlide’s Power BI Link enables you to reduce your time spent on low-value-added tasks and be sure the data in your presentation is always up-to-date.
Plus, you can easily change slicer values on all or selected visuals with our easy dropdown menu. Duplicate entire reports for different business units or time frames simply by editing slicers within PowerPoint and Word.
Ready to Save Even More Time in Power BI?
We hope you’ve found this guide to exporting Power BI to Excel useful. Please feel free to bookmark it for later!
If you’d like to see UpSlide’s Power BI to PowerPoint Link in action and discover how your teams can build better documents faster, please talk to a member of our team.
Here are some resources to help you increase your efficiency in Power BI:
- Read the article ‘How, and why, do finance professionals use Power BI?‘
- Get a full Power BI training session by F31 experts
- Access Microsoft’s Power BI Guide
- Discover UpSlide’s Knowledge Hub for more efficiency tips
TL;DR
Export refreshable dashboards with ‘Analyze in Excel’ – if you want to study your Power BI datasets, it may be more suitable to work in Excel. By importing the entire dataset, you have more flexibility, as long as you make sure that your metrics are created in advance so you can use them in your tables and graphs.
Export data from a Power BI visual – it is useful when you are simply looking to obtain the data underlying a visual on a Power BI report.
Create PivotTables in Excel – it’s a relatively quick and easy way to export Power BI data to Excel. However, if you didn’t create the Power BI dashboard yourself, selecting the correct PivotTable fields could be time-consuming.
Create Tables in Excel – it offers more flexibility than creating a PivotTable, but still has its limitations. If you’re not well-versed in DAX language or Power BI, this option could be time-consuming.


