Automatically Build Advanced Excel Charts with UpSlide

Build Reports Faster
Create complex, on brand financial charts in seconds.

Always Remain On-Brand
Create brand consistent charts every time with automated formatting features.

Guarantee Data Accuracy
Reduce the risk of manual error by refreshing all charts with one click.





Efficiently Create Impactful Reports
Deliver more effective analysis with data visualization that doesn’t require time-consuming chart updates and formatting.
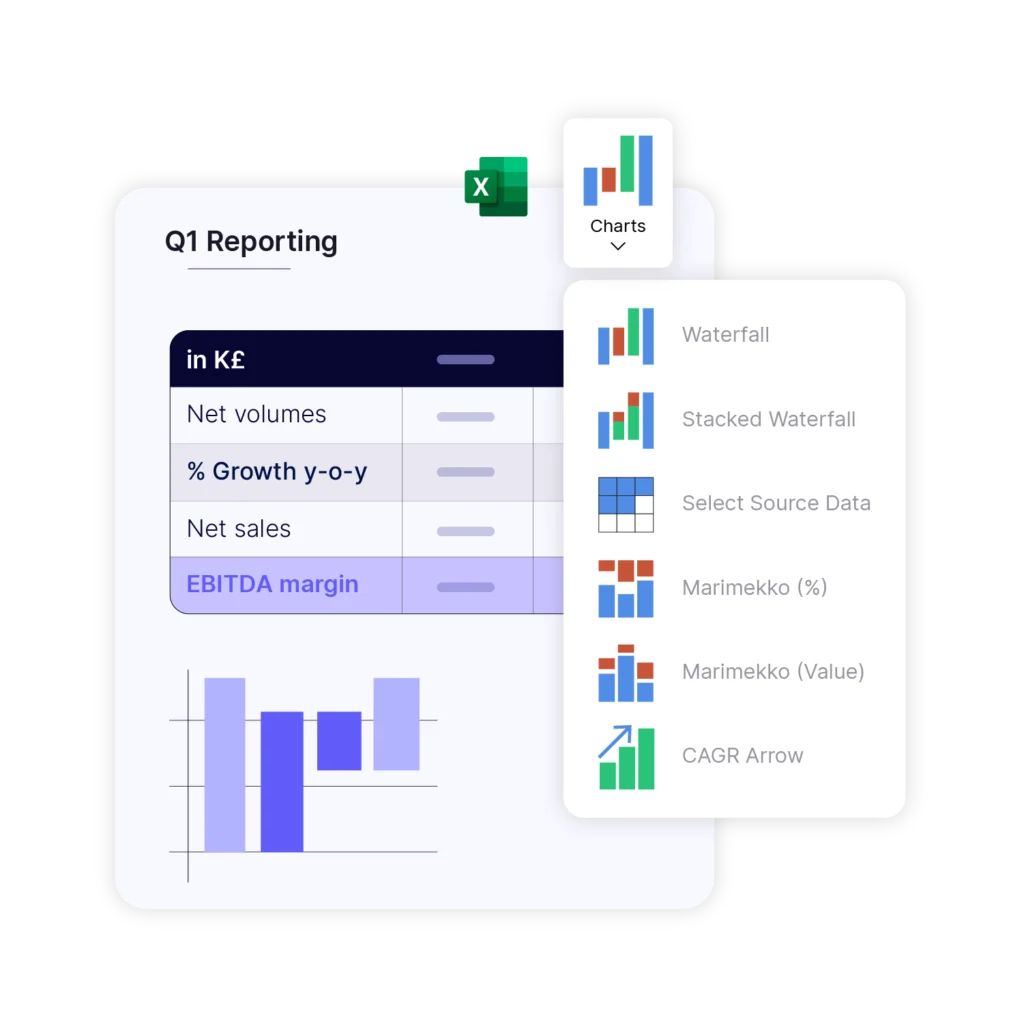
Build advanced charts in Excel, such as Marimekko, Waterfall, and Stacked Waterfall charts, or add CAGR arrows in one click. Plus, refresh your data in seconds, saving precious time for analysis.

Always Remain On-Brand
Remain confident that all charts within your report comply with your graphic charter.
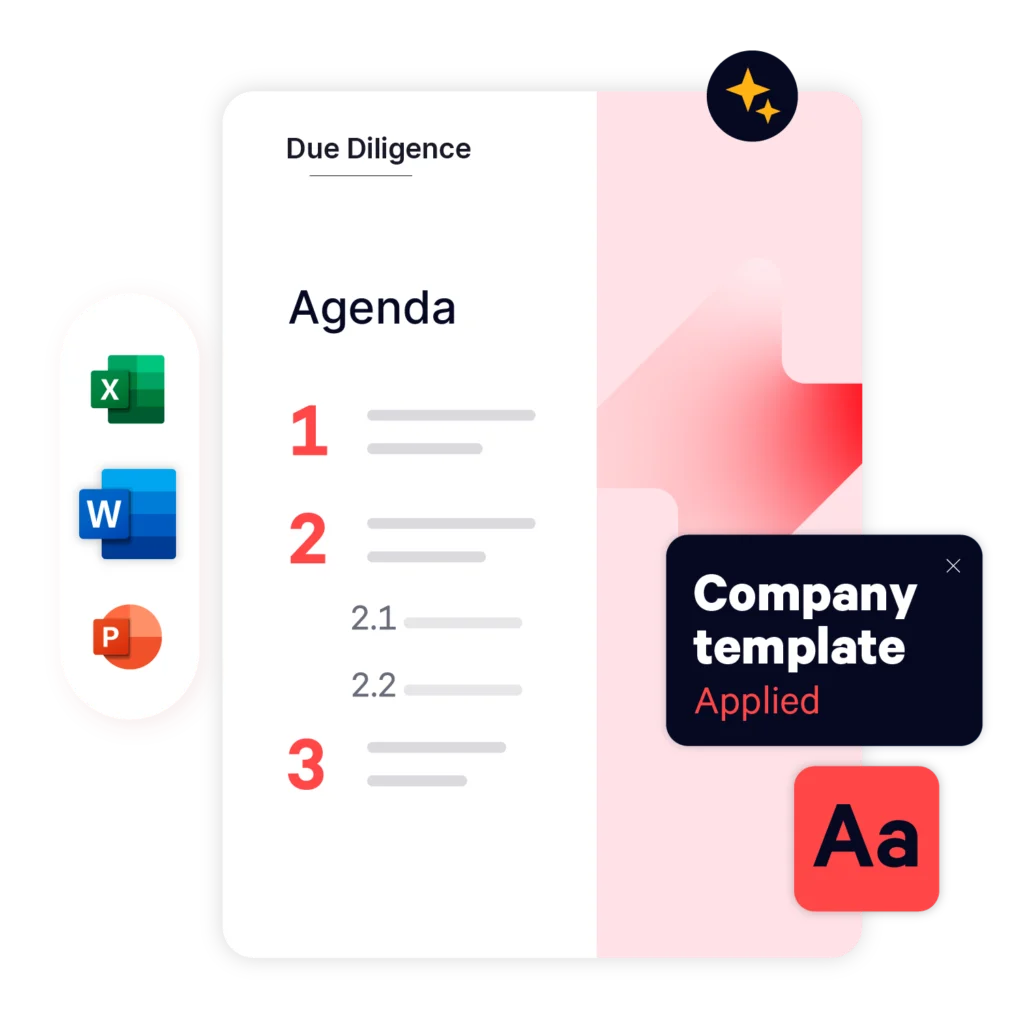
Standardize all advanced Excel charts you or your team present across Microsoft 365 applications with customized automation tools.
Build Better Reports Faster
Our Microsoft 365 Expertise
helping teams work better in Microsoft 365

average renewal rate
We needed a solution allowing our Finance, Investor Relations and Investment teams to use Microsoft Excel fully and to efficiently link Excel data into PowerPoint.
Rachel Cormican, Marketing Manager, Coller Capital


The time saved with UpSlide is immense, on average it’s in excess of six hours per report we create.
Jennifer Bailey, Operations Manager, Colliers


UpSlide allows us to focus on the most important parts of our jobs. It runs seamlessly in the background and is intuitive to use. UpSlide is so integrated into our processes now that you forget it’s even an add-in!
Aakash Kotak, Associate, Campbell Lutyens


Frequently Asked Questions
How Does this Compare to Native Microsoft Functionality?
We built UpSlide features to answer the specific needs of professionals working heavily in Microsoft 365. While Microsoft offers an array of brilliant native functionality in Excel, like the ability to build pie and bar charts, we offer more specialist features that are tailored to the finance industry. With UpSlide, you’ll have the flexibility to build complex, branded Waterfall and Marimekko charts in seconds.
What Types of Advanced Excel Charts Can You Generate with UpSlide?
Our Advanced Excel Chart tools enable you to create perfectly formatted Waterfall, Stacked Waterfall, Marimekko, Bridge and CAGR charts.
How Secure is UpSlide?
Leading financial firms trust UpSlide thanks to our stringent security measures. We successfully completed a System and Organization Controls (SOC) 2 Type II audit, reflecting our commitment to the highest standards of security, availability, processing integrity and confidentiality.
We perform a security audit of our code before every release, use automated and manual testing to ensure each version meets strict quality and security standards, and integrate vulnerability management tightly within our development processes. UpSlide also integrates within your infrastructure, enabling you to keep full control of it. Even if you choose to use a cloud source for your library content, we still have zero visibility of your data.
How Much Does UpSlide Cost?
UpSlide prices depend on the number of licenses you require, the options you want and your setup model. If you want to know how much UpSlide would cost for you, please get in touch with us, and our team will be happy to give you a personalized quote.
Can I Get an UpSlide Trial?
As UpSlide is a completely customized solution, we tailor our technology to your unique needs and brand, so you get a high ROI. Therefore, we don’t typically offer free trials. However, we do recommend having a chat with one of our experts to discuss your challenges in Microsoft 365 to see how we can help you achieve your strategic goals.
