BNP Paribas Optimizes Recurring Report Creation with UpSlide
2k+
users
13+
years with UpSlide
50+
regions
Thanks to UpSlide’s Excel to PowerPoint Link, we can finally spend more time on reporting and analysis instead of collecting and checking figures.

Thibaut de Clerck,
Head of Management Control, IFS
BNP Paribas
Most Used Features
Objectives

Automate report production to spend more time on analysis.

Optimize cross-team collaboration and knowledge sharing.

Maintain compliance with airtight data accuracy.
Context
International Financial Services (IFS) combines specific complementary activities at BNP Paribas Group. These include international retail banking, insurance, private banking and asset management.
The Management Control team consolidates and analyzes accounting data across all IFS entities.
Various quarterly reports are produced throughout the financial year to forecast and interpret figures, focusing on budgets, estimations and final outcomes.

UpSlide optimizes our recurring reports compiled from the same source files.

Thibaut de Clerck,
Head of Management Control, IFS
BNP Paribas
Challenge

There are several stages to optimizing reports:
- Extracting financial data from multiple IFS entities.
- Updating the Excel buffer file with all new figures.
- Duplicating the previous PowerPoint report and updating all figures.
- Analyzing discrepancies and changes, and reporting in a PowerPoint report.
The main challenge for the team is finding more time to spend on the final stage of analysis and writing.

The UpSlide Project
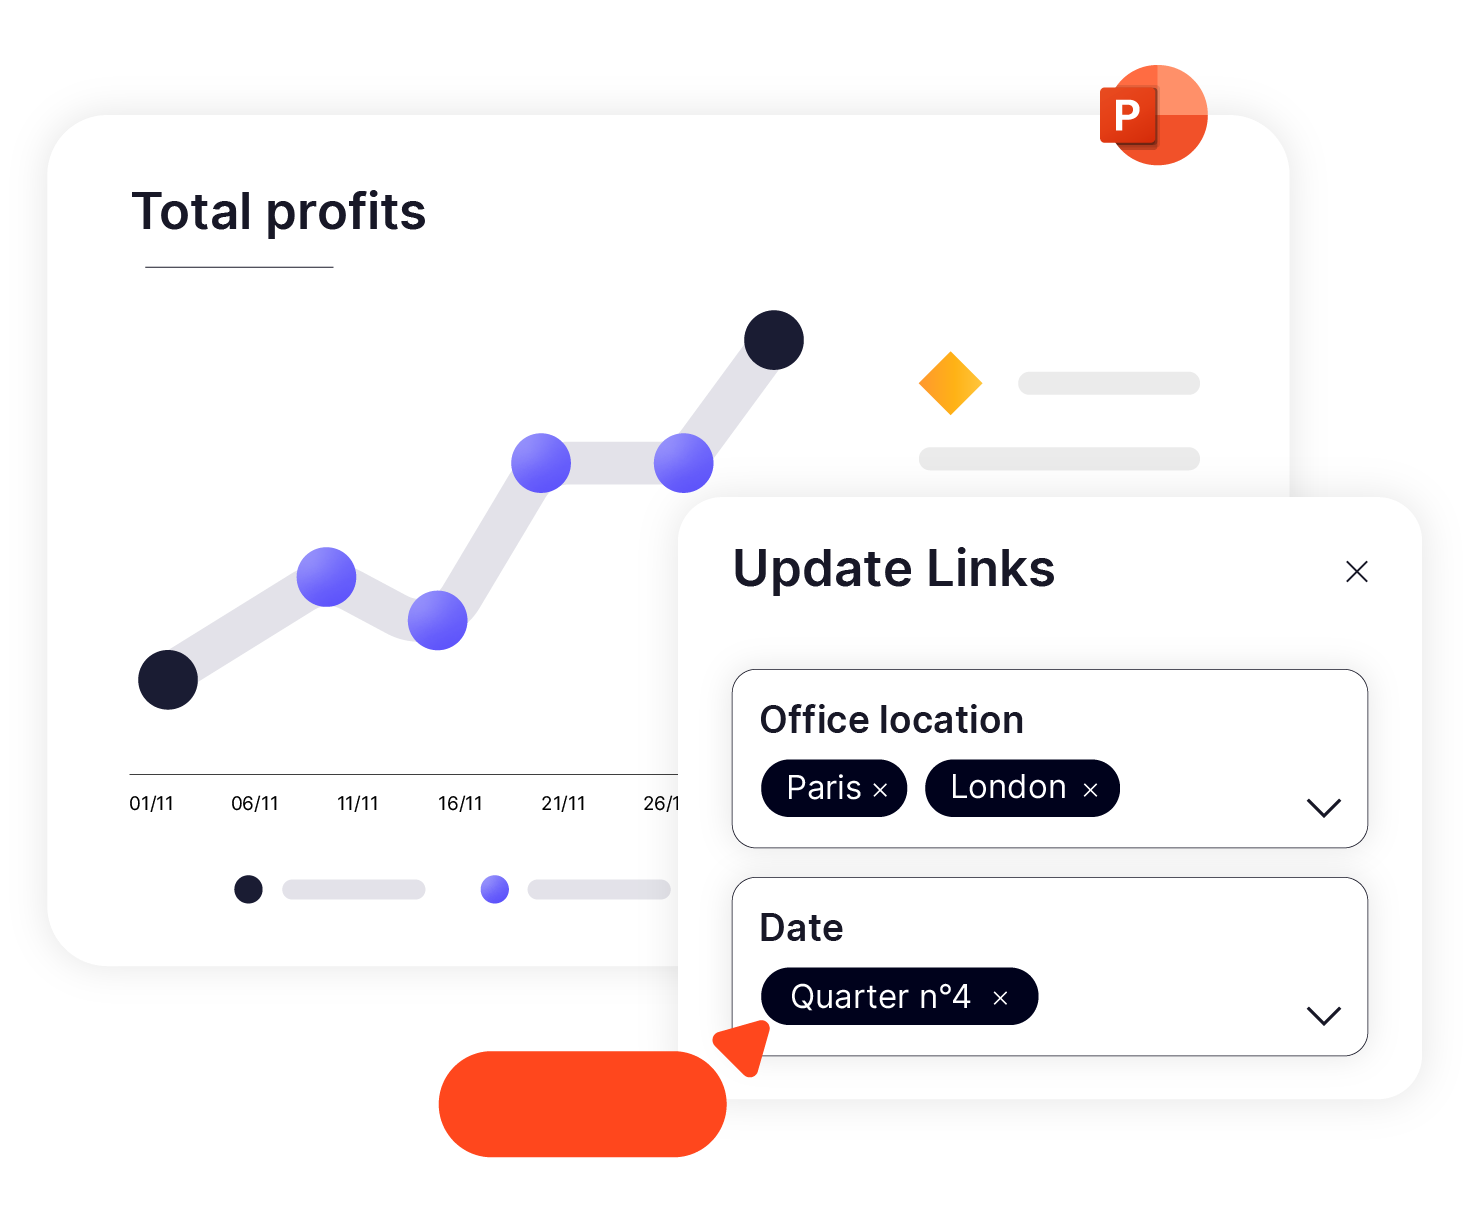
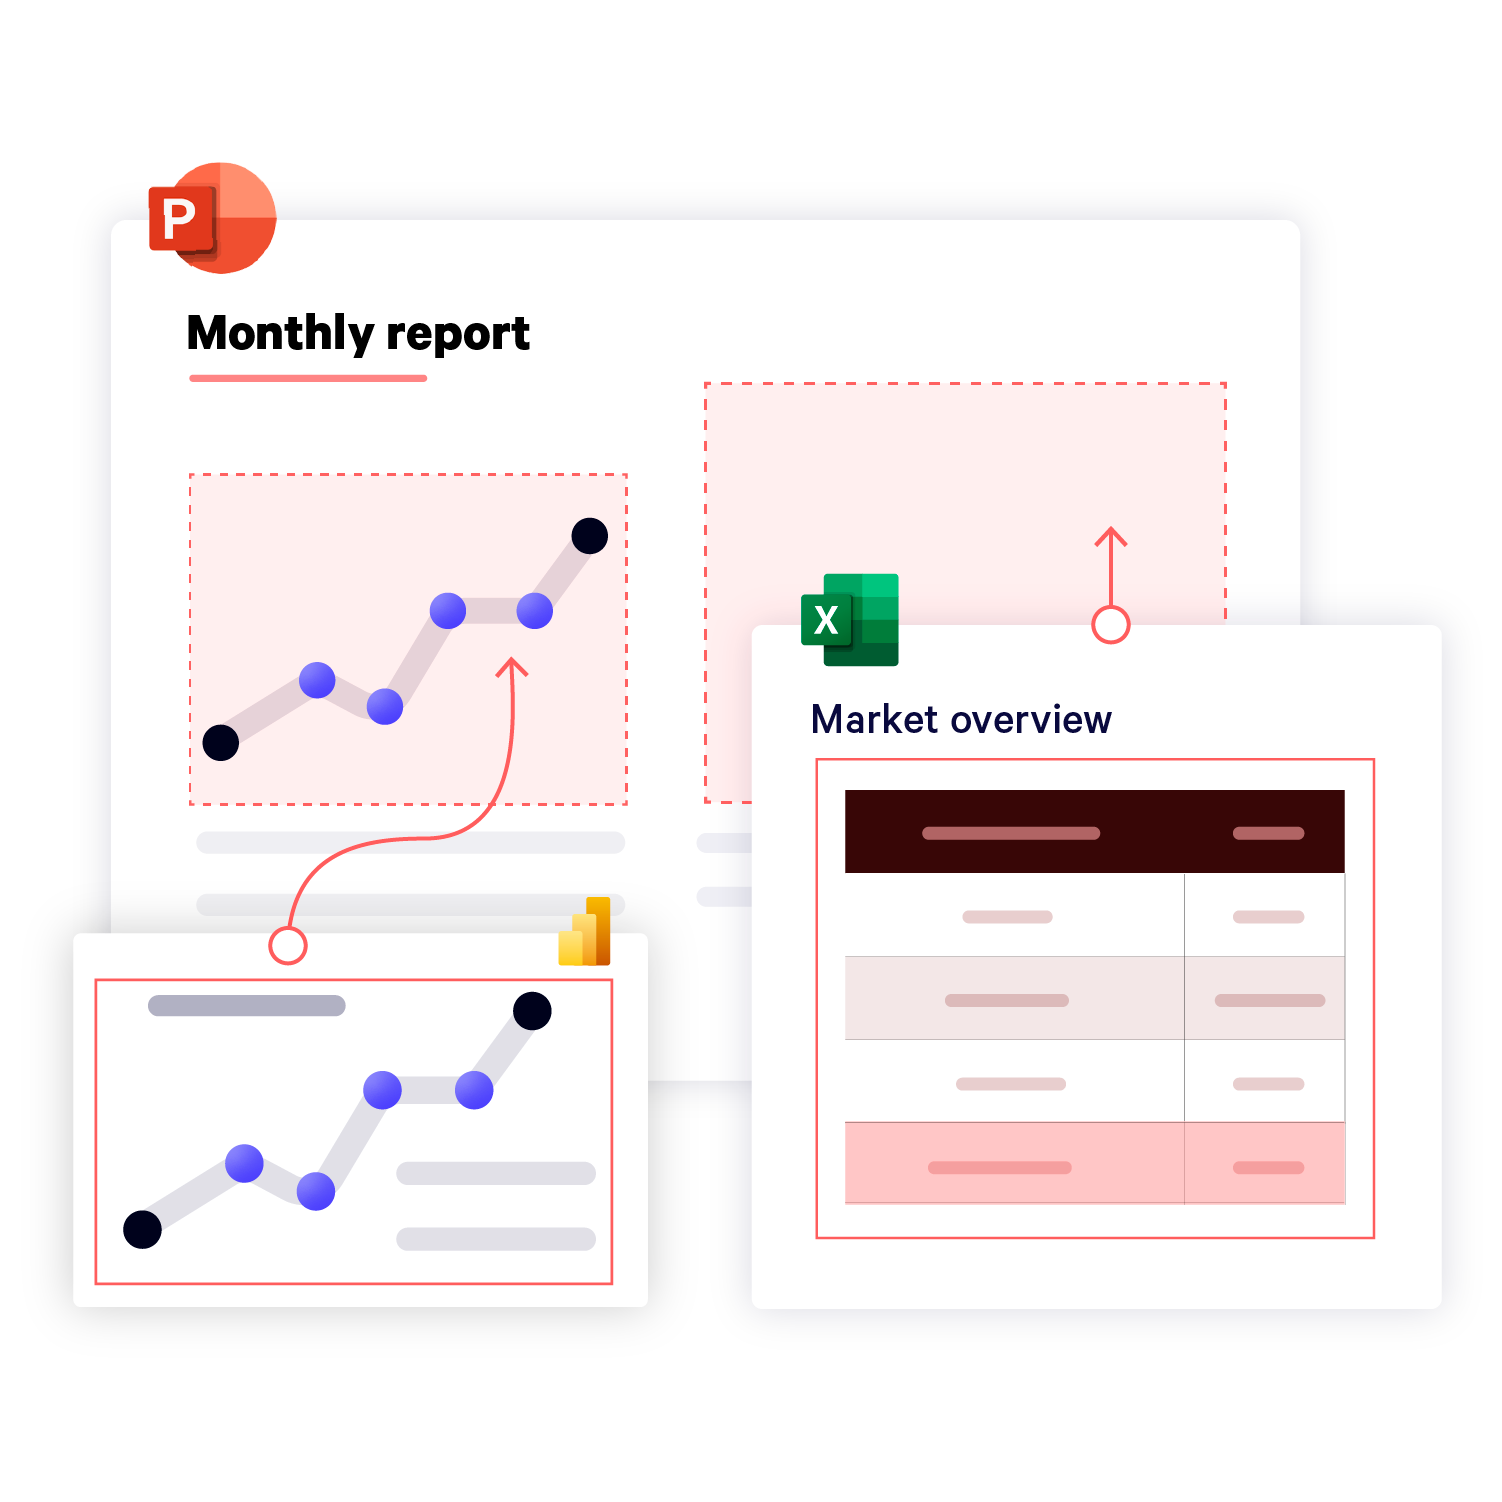
UpSlide allows us to optimize Excel data extraction and updates as well as duplication in PowerPoint.
Now, all we have to do is update the Excel file and our PowerPoint reports are then updated with the latest available financial data.
As soon as new figures are integrated into the PowerPoint report draft, our team can review them, comment on changes and forecast discrepancies.

Now just one person can take care of extracting and updating our data. This allows the rest of the team to concentrate on tasks that add value.

Thibaut de Clerck,
Head of Management Control, IFS
BNP Paribas
Impact

Enhanced Productivity
“The ability to update multiple Excel links at once in PowerPoint is a precious time saver when working on reports which are more than 180 pages long!
We also create text links from specific Excel cells, which saves us having to make the same changes in PowerPoint.”

Airtight Data Compliance
“The Go to Source function helps us to quickly find the Excel source file for a PowerPoint report chart or table.”

Seamless Collaboration
“I’m a big fan of the Send feature. Now we can send a set of PowerPoint slides by email as a direct attachment or in PDF format, as soon as the report is complete.”


