More and more professionals are using BI (Business Intelligence) tools to make decisions based on real data: in 2016, already 39% of industry leaders claimed to be highly data-driven according to a study carried out by PwC.
Companies are becoming “data-driven“, i.e. they collect, analyze and exploit data in order to manage their strategy. The wealth and breadth of data allows them to get to know their customers better, monitor their performance in real time, and facilitate reporting and control.
Any company who wants to improve decision making using data must have a tool adapted to its size, its objectives and its teams. The two leading data analysis software tools are Tableau (from Salesforce) and Power BI, the solution developed by Microsoft. But which one is better between Power BI vs Tableau?
To help you choose the right tool, we are going to address the 10 questions you need to ask yourself before you decide between the two.
TL;DR
In this blog we compare Power BI and Tableau, two popular business intelligence (BI) tools used for data analysis and decision-making.
The blog explores the importance of being data-driven in today’s business landscape and the benefits of using BI tools.
Read on to discover 10 questions to consider when choosing between Power BI and Tableau. These questions cover factors such as company size, ease of use, data sources, data preparation, data models, information reporting quality, compatibility with Microsoft Office 365, cost, and our UpSlide expert opinion.
Why Use a Business Intelligence Tool?
Adopting a BI tool is above all about adding value to your company’s data through easy access to information and informed decision-making.
Power BI and Tableau software allow you to:
- Consolidate different sources and aggregate data
- Define the key indicators (KPIs) useful to the company
- Format analysis through the creation of visual dashboards
- Share information to different user groups
Between them, Power BI and Tableau have been around for 20 years and have millions of users – 350,000 for Tableau in 2017 and around 5 million for Power BI in 2016.
These software programs are very popular, especially in the financial sector.
▶ How do financial professionals use Power BI?
Power BI vs. Tableau: What is More Appropriate for My Company Size?
Two factors should be considered: your budget and the data volume.
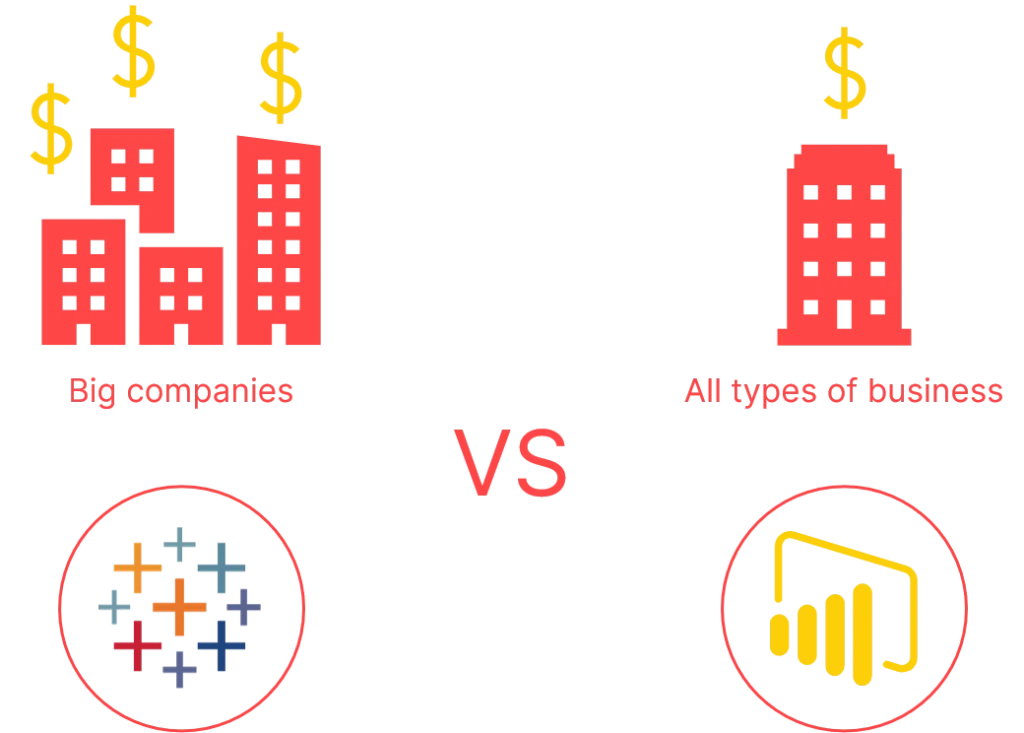
From a data volume point of view:
- Tableau can manage big data: suitable for large companies.
- Power BI is historically known to manage smaller volumes. However, since its launch 5 years ago, Microsoft’s solution has come a long way and can manage a large volume of data, with several million lines, provided that certain good modeling practices are followed. It can therefore also be suitable for large companies without any problems.
For financial reasons (see detailed pricing in question 9):
- Power BI is suitable for small, medium and large organizations
- Tableau is more suitable for medium and large organizations.
Which Tool is the Easiest to Use?
For the tools to be easy to master, the data model must, above all, be clean and well-constructed. If this is not the case, it will always be difficult to produce quality dashboards and visuals, regardless of the tool used.
Power BI
Regular Office suite users will appreciate the interface as it is similar to Excel and PowerPoint with a ribbon offering several buttons and construction tools.
Power BI uses two coding languages that need to be understood well:
- The M language used in the data preparation brick integrated in Power BI called Power Query. It is essential to know how to code in M to reprocess its databases.
- For the calculations (KPIs calculations, data restitution), it is necessary to use the DAX language whose syntax is close to that of Excel for the most basic functions. Thus this language is easily understandable for a beginner user with some knowledge of spreadsheet but will require a certain investment of time to master it.
Tableau
Understanding the interface and using it is trickier for a first-time user.
On the other hand, Tableau’s advantage lies in the ease with which dashboards can be created: simply drag and drop the visuals into a dashboard tab (one tab per visual).
However, Power BI and Tableau are still technical, and mastering their subtleties is essential to make the most of them.
If you are looking for good advice or want to showcase the work you have done: there are very active and responsive communities for both softwares! Visit the forums, where users can compare their models and easily find answers to their questions.
Here are some useful resources to enhance your Power BI learning:
What Data Sources Can be Used?
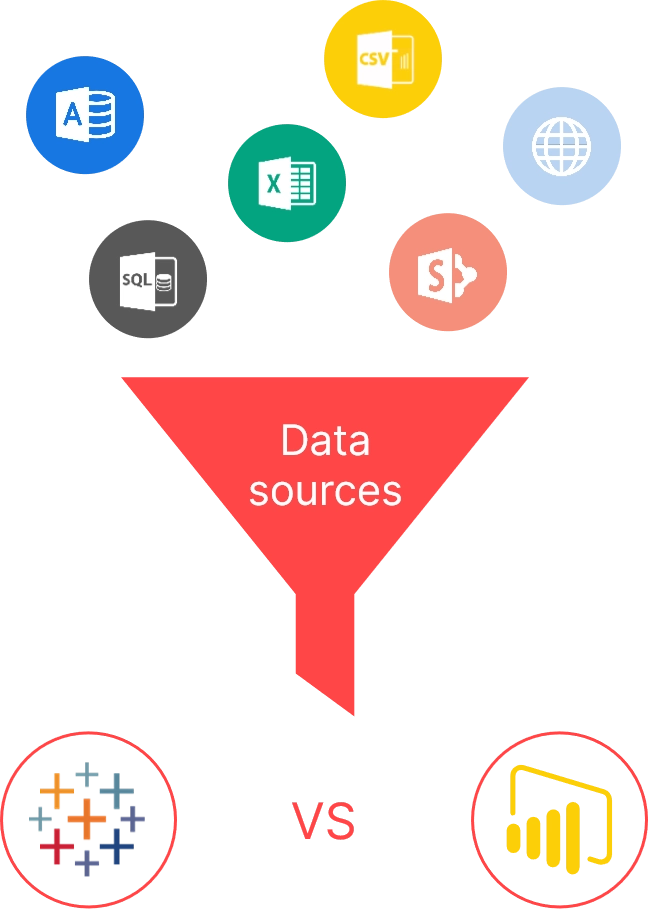
Power BI and Tableau support multiple data sources; you can connect to external sources from both tools by import or live connection.
Compare the lists of data sources compatible with both tools:
Data management maturity:
- Power BI is very flexible in the preparation of data, and so it adapts both to companies with data warehouses with already prepared tables and to companies with less structured databases that can be reprocessed in DAX.
- Tableau requires cleaner and more structured data. Therefore, the software is better suited for companies that already have an advanced data strategy (e.g. with a team of data scientists, structured data warehouses, an elaborate data preparation process, etc.).
Which Tools are Needed to Prepare the Data?
Power BI
Data preparation is done in Power Query, which is integrated into Power BI. It is easy to use, and handling is straightforward because many of the transformations are guided – many reprocessing possibilities are available via buttons – or are similar to what can be done in Excel.
Tableau
The data transformations are done in an additional software called Table au Prep Builder.
This software does not require any coding skills to clean its data. The tool works via a “flow” model in which the user makes step-by-step modifications/unions/aggregations. The tool is relatively intuitive so that a person with basic notions of data preparation can find their way around.
Which Data Models are Being Used?
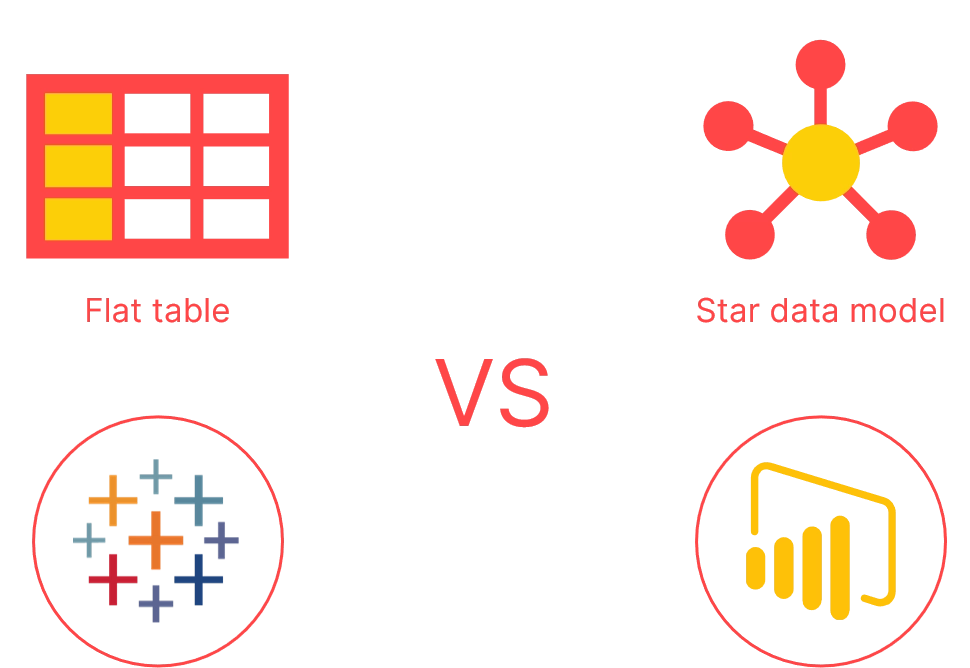
Both solutions suggest creating star data models from multiple tables.
Power BI best practices suggest only working with data models in the software, while Tableau prefers flat tables.
What is the Quality Needed for the Information Reporting?
Power BI
Power BI has made a lot of progress with regards to visuals, with the possibility of integrating a graphic charter to generate visuals with the charter colors automatically. The management of objects is close to that of PowerPoint (lasso, grouped movement). The user can position the visual, which makes creating the dashboard take longer, but is more flexible. A marketplace also allows you to download visuals developed by external users, if the native solutions do not meet your needs.
Tableau
Tableau is known to allow the user to create clear and aesthetic visuals and dashboards very quickly. The user creates a tab for each visual and then groups them in a new dashboard tab by dragging the chosen visuals. As the visuals are automatically placed (they are dragged and nested), dashboard creation is faster than in Power BI, but less flexible in the page layout.
Does my Company use Microsoft Office 365?
For compatibility purposes, it is strongly advised to consider your existing tools before buying a new software. For example, the use of the Microsoft Office suite in finance is prevalent, which makes the integration of Power BI and Tableau an important decision factor for this industry.
Power BI
As it is part of the Microsoft system, it is designed to work easily with the Office suite. Many native connectors allow you to retrieve data from SharePoint, Excel, Outlook… It is also possible to share reports in your Microsoft Teams channels, so that the information is easily accessible to all your teams!
Reports shared with users are published on “Power BI Service” (app.Powerbi.com), exporting your data to the Office Suite is very simple:
- How to Export Power BI to Excel
- 4 Effective ways of connecting PowerBi to PowerPoint
- Install the Power BI – Word link free (from UpSlide)

Need a little bit extra? Depending on your Office license (E5), a Power BI Pro license can be included, at no extra charge. It is easier to adopt and everything is done with the same Office 365 account, which is very easy to use.
Tableau
Like many software designed for large companies, Tableau fits very well with Microsoft infrastructure, especially via the Tableau platform on Azure. So you won’t have any trouble connecting the two softwares.
Which is Cheaper?
When deciding between Power BI vs. Tableau, cost will be playing a huge part of your decision. So let’s look at the cost breakdown:
How Much Does Power BI Cost?
You can now design dashboards (without sharing options) on the Power BI Desktop application, which is available for free download. (Download the Power BI Desktop).
To share your data models and publish your reports online, a paid version is required:
- Power BI Pro:
- Individual license 8.40 euros per month, per user
- Allows you to publish and share your reports with other Power BI licenses.
- Power BI Premium:
- Enterprise license, from 5, 000 euros per month
- Dedicated capacity for the company
- Allows reports to be shared across the enterprise at no additional cost
- A Pro license is required for report developers, in addition to the company’s Premium license, in order to publish reports.
How Much Does Tableau Cost?
The main disadvantage of Tableau is its cost. To share your data models and publish your reports online, a paid version is required: Tableau is more expensive than Power BI. The price of individual licenses varies according to the rights granted:
- Tableau Creator:
- Individual license $70 per month, per user
- Gives access to all Tableau options: allows you to create, edit and share dashboards
- Includes Tableau Desktop (dashboard development) and Tableau Prep Builder (preparation of underlying data)
- Tableau Explorer:
- Individual licenses, available for a minimum of 5 people, at $35 per month, per user
- Limited rights compared to a Creator license
- Tableau Viewer:
- This type of license is available for a minimum of 10 people, and costs 12$ per month per user.
- Even more restricted rights, with the ability to view dashboards and interact with the content by creating custom views, or downloading a summary of the underlying data.
- Public Tableau:
- This is the free trial version that can be used without a license. The reports developed and published in it are public (everyone has access to it).
The above prices correspond to on-premise data hosting (locally) or on a public cloud. A premium subscription to these two softwares is required to host your data with a capacity dedicated to the company.
UpSlide’s Opinion
The use of the Office suite remains widespread, especially in Finance. However, today’s challenges are pushing companies to collect more data and above all to analyze it, in order to better understand their environment and make better decisions.
We believe that tomorrow’s financial report will be:
- Automated, by processing data in real time from several sources
- Accessible, i.e. easy to use and available on any type of screen
- Reliable, thanks to clean data and secure hosting
Although Tableau has proven itself in terms of data visualization, Power BI has conquered hundreds of thousands of companies around the world in just 5 years of existence.
Indeed, the new software is part of the Microsoft landscape and therefore benefits from its huge user base, who find it easier to get started with Power BI thanks to its compatibility with Excel (native connectors, Power Query) and its interface which is similar to Office.
Finally, its price remains much more attractive and can even be included in a Microsoft Office 365 license.
For all these reasons, we are convinced that Power BI is the report of tomorrow: we have developed UpSlide features to connect Power BI to PowerPoint, Excel and Word, and thus ease the transition for companies in their quest for data.
UpSlide built a Power BI vs Tableau comparison matrix to sum up its opinion on both tools:
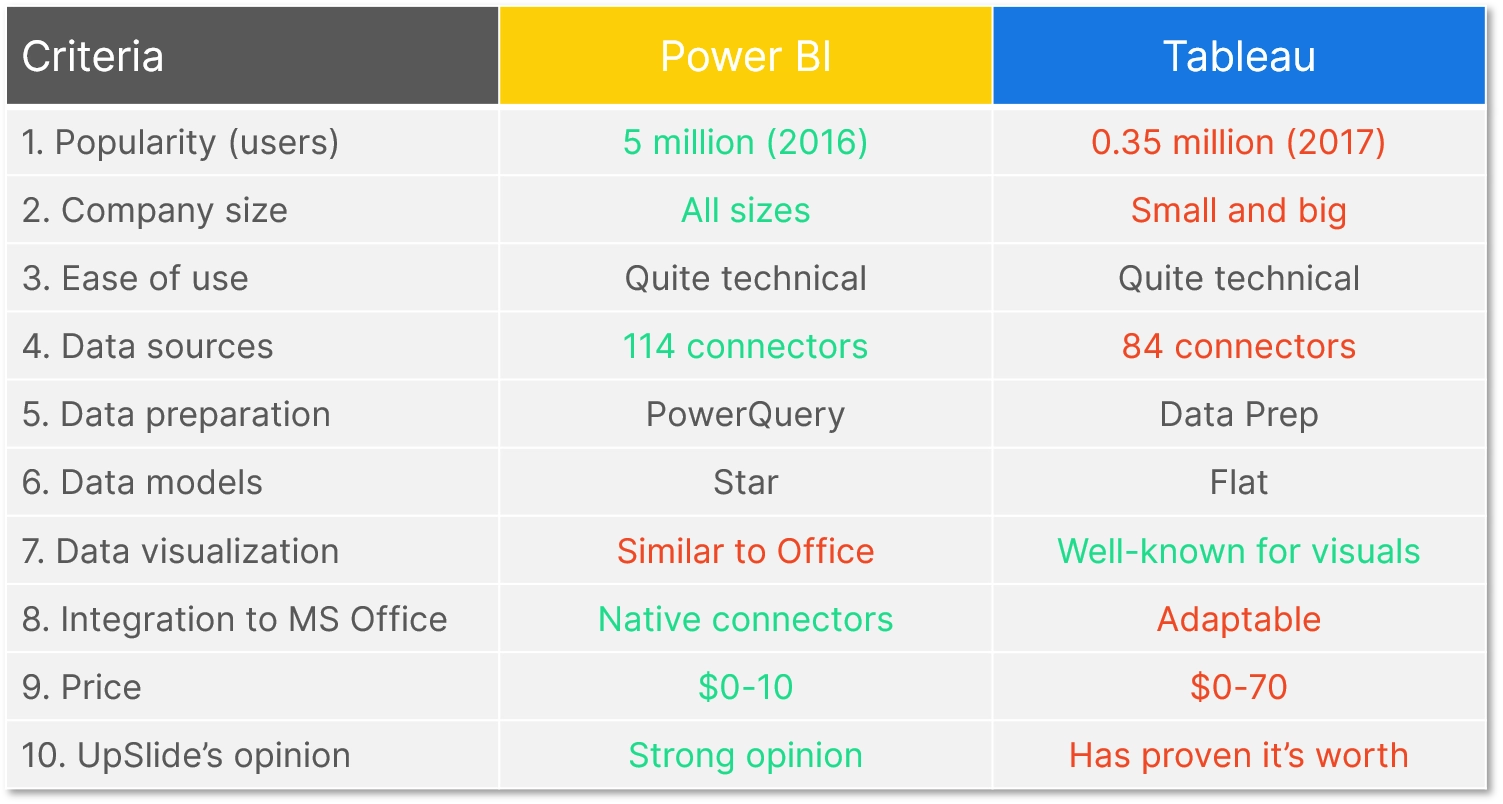
So, at the end of the Power BI vs. Tableau comparison, which software suits you best?
If you are impressed by Power BI and are also working on the Office suite:

